- Mark as New
- Bookmark
- Subscribe
- Mute
- Subscribe to RSS Feed
- Permalink
- Report Inappropriate Content
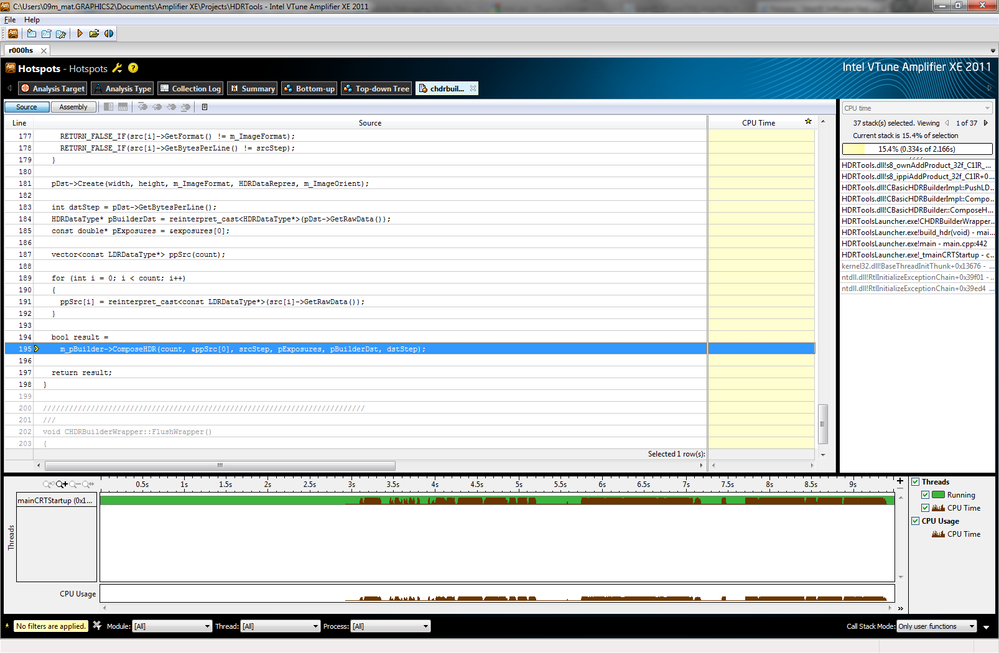
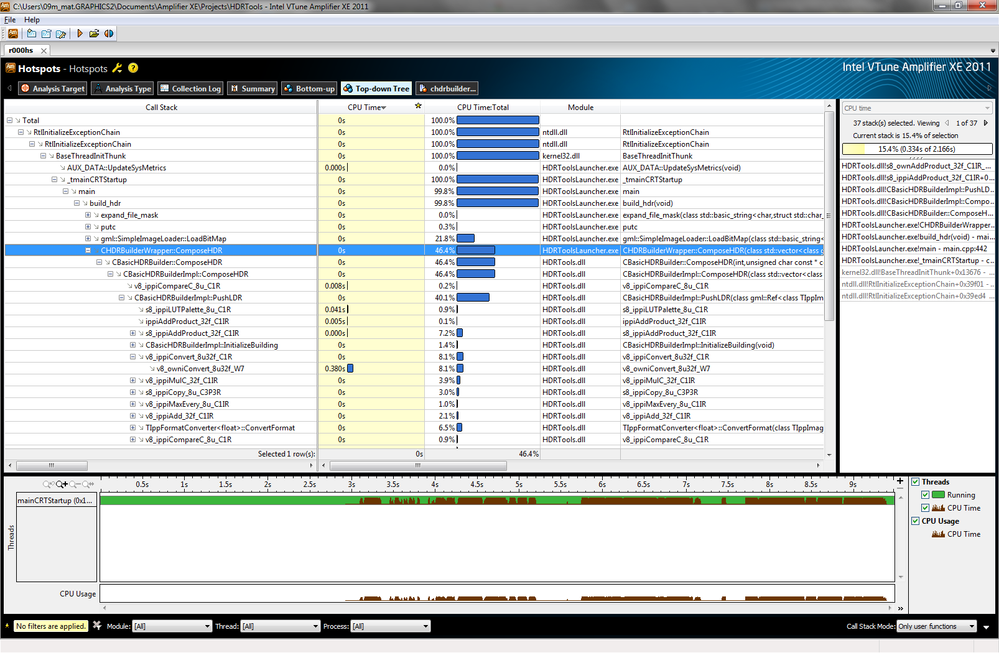
However, I cannot see any values in "CPU Time" column in source pane for any line of source code. Code itself is clearly displayed and routines are profiled within other panes.
Executable profiled is built with VS'05 under Release configuration with generated pdb. Intel VTune Amplifier XE 2011 Update 2. Windows 7 x64.


- Mark as New
- Bookmark
- Subscribe
- Mute
- Subscribe to RSS Feed
- Permalink
- Report Inappropriate Content
The total time column presents self time of the funcion plus time of all subfunctions. Please refer to the picture below. I've switched from percents to time for convenience. In the example function WinMain have two called functions: main and WindowProc. Total time of WinMain is 1.420s. Is consists of self time (0.041) and time consumed by called functions: 1.357 by main and 0.021 by WindowProc. 1.420 = 0.041 + 1.357 + 0.021.

Top-down tree gives list of functions and their hierarchy. As it shows function itself and it's subfunctions, it's convinient to see both CPU time (self function time) and Total time (time including subfunctions). From this you can understand how much time the function consumes and what part of this time is actually consumed by called function.
In the code pane you see particular code line - it belongs to one function only. So only function self time makes any sence here - the CPU time. It is divided to code lines, so sum of CPU times of all function lines is equal to the function self time. Code view doesn't show full hierarchy, so there is no need to include called function time there. It would make confusion.
Code view is intended to show time consumed by each line in one function. So only CPU time is relevant.
Top-down tree is intended to show time consumed by each function and it's subfunctions. There is need to separate function self time from time of the called functions. That's why there are both CPU time and total time.
Regards,
Kirill
Link Copied
- Mark as New
- Bookmark
- Subscribe
- Mute
- Subscribe to RSS Feed
- Permalink
- Report Inappropriate Content
Mikhail,
We may need additional information
about what you are attempting to accomplish.
The Top-down Tree pane represents call sequences (stacks) detected
during collection phase starting from the application root (usually, the main()
function). Use this pane to see the impact of program units together with their
callees.
There may be some points about the
top-down view that need to be clarified.
For example, the CPU Time: Total value for a row is equal to the sum of
all the nested items from that row. For example, in the screen capture above,
the Total time values (in percent) for the nested items. However, the CPU Time is the active processor
Self time spent in the function. Additional
information about the top-down window can be found at:
http://software.intel.com/sites/products/documentation/hpc/amplifierxe/en-us/lin/ug_docs/index.htm#olh/common/lightweight_hotspot_analysis.html
Depending on what you wish to
accomplish, you may be interested in the bottom-up view especially on the first
pass through to indentify the hottest functions. Additional information about the bottom-up
analysis view can be found at:
http://software.intel.com/sites/products/documentation/hpc/amplifierxe/en-us/lin/ug_docs/index.htm#olh/common/lightweight_hotspot_analysis.html
Also good to know is that the
Top-down Tree window is synchronized in essence with the related Bottom-up
window. For example, if you select a program unit in the Bottom-up window and
click the Top-down Tree tab, then the selected program unit is highlighted in
all call sequences. Self time for such a
program unit in the Bottom-up pane equals the sum of Self time values for the
same program unit in different call sequences in the Top-down Tree pane. If you
select several items in one pane and switch to the other pane, the Selected
value for the Self time, provided at the bottom of the data table, is the same.
The recommended methodology for
interpreting hotspot analysis results is outlined here:
http://software.intel.com/sites/products/documentation/hpc/amplifierxe/en-us/lin/ug_docs/olh/common/interpreting_hotspot_analysis_results.html
Let us know if you need additional
information or if this information answers your question.
Thanks
Rob
Intel Support
- Mark as New
- Bookmark
- Subscribe
- Mute
- Subscribe to RSS Feed
- Permalink
- Report Inappropriate Content
Really appreciate your expanded answer. Provided links might be very useful during ongoing profiling.
However, I've asked one simple question: "where are analysis results in the source pane?" And didn't receive answer.
You see, Rob, I understand you have to communicate with all the people who cannot RTFM and you can't just tell the hell 'em to do it. But the things I want to hear from Intel Brown Belt owner is something I cannot find in manuals. And indeed, I wasn't able to realize why results are empty for source code pane while everything is OK for other panes.
- Mark as New
- Bookmark
- Subscribe
- Mute
- Subscribe to RSS Feed
- Permalink
- Report Inappropriate Content
The function CHDRBuilderWrapper::ComposeHDR shows 0 seconds in CPU time. Thats why corresponding CPU time field in source pane is empty.
If you select a function that has some non-zero CPU time, e.g. s8_ippiLUTPalette_8u_C1R, there will be non-zero CPU time in source pane also.
Please note that only few instruction lines have a CPU time value. To go to instruction of interest use navigation buttons in the top of source pane.

In the bottom of CPU time column there is cumulative time - if value is not empty, some instructions have CPU time as well. It's just needed to scroll to them. I hope this helps.
Regards,
Kirill
- Mark as New
- Bookmark
- Subscribe
- Mute
- Subscribe to RSS Feed
- Permalink
- Report Inappropriate Content
Now it is clear. But the next question is: why there is no "CPU Time: Total" column in source pane, while it is present in tree pane? What if I'd like to go through code of some function analyzing total time spent in every line of code? In this case "CPU Time" metric is not really relevant. Is there a way to accomplish such a task? - .
Thanks again.
- Mark as New
- Bookmark
- Subscribe
- Mute
- Subscribe to RSS Feed
- Permalink
- Report Inappropriate Content
The total time column presents self time of the funcion plus time of all subfunctions. Please refer to the picture below. I've switched from percents to time for convenience. In the example function WinMain have two called functions: main and WindowProc. Total time of WinMain is 1.420s. Is consists of self time (0.041) and time consumed by called functions: 1.357 by main and 0.021 by WindowProc. 1.420 = 0.041 + 1.357 + 0.021.

Top-down tree gives list of functions and their hierarchy. As it shows function itself and it's subfunctions, it's convinient to see both CPU time (self function time) and Total time (time including subfunctions). From this you can understand how much time the function consumes and what part of this time is actually consumed by called function.
In the code pane you see particular code line - it belongs to one function only. So only function self time makes any sence here - the CPU time. It is divided to code lines, so sum of CPU times of all function lines is equal to the function self time. Code view doesn't show full hierarchy, so there is no need to include called function time there. It would make confusion.
Code view is intended to show time consumed by each line in one function. So only CPU time is relevant.
Top-down tree is intended to show time consumed by each function and it's subfunctions. There is need to separate function self time from time of the called functions. That's why there are both CPU time and total time.
Regards,
Kirill
- Mark as New
- Bookmark
- Subscribe
- Mute
- Subscribe to RSS Feed
- Permalink
- Report Inappropriate Content
- Subscribe to RSS Feed
- Mark Topic as New
- Mark Topic as Read
- Float this Topic for Current User
- Bookmark
- Subscribe
- Printer Friendly Page