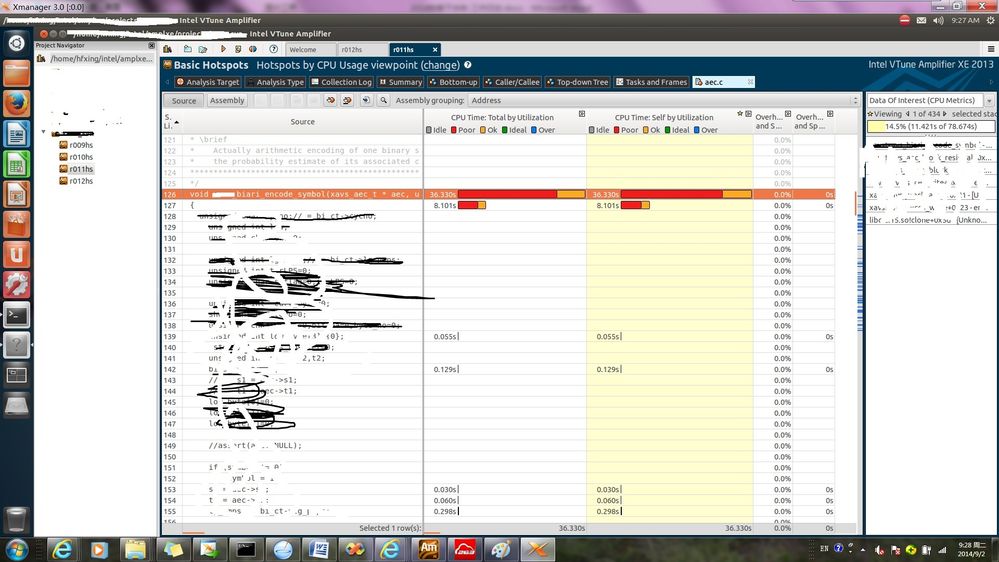
Hi,I am using vtune amplifier to analyze coding efficiency about video encoding. I found the most consuming code is arithmetic coding module. In “Caller/Callee” tab, I double click the function of the core arithmetic coding which is called frequently, the time consuming of this function is showed. My question is, when the most time consuming code line is the function name line, what’s the meaning?
連結已複製
4 回應
Usually it was due to compiler's issue...compiler will generate optimized code sequence for performance consideration, that didn't match original source code's order. You can click on one source line then click "Assembly" button in source view of VTune, it will display assembly code for corresponding source line.
