- Mark as New
- Bookmark
- Subscribe
- Mute
- Subscribe to RSS Feed
- Permalink
- Report Inappropriate Content
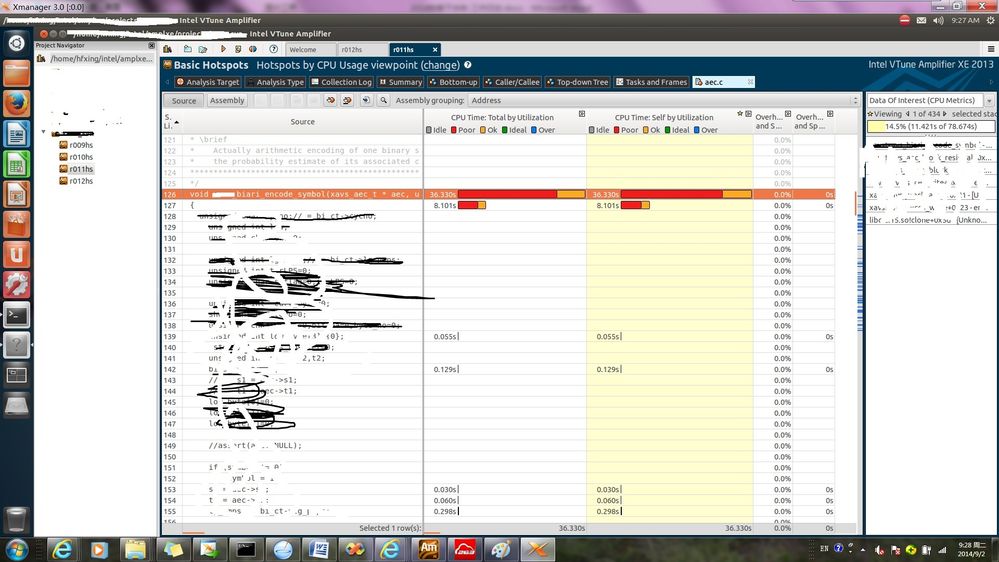
Hi,I am using vtune amplifier to analyze coding efficiency about video encoding. I found the most consuming code is arithmetic coding module. In “Caller/Callee” tab, I double click the function of the core arithmetic coding which is called frequently, the time consuming of this function is showed. My question is, when the most time consuming code line is the function name line, what’s the meaning?
Link Copied
- Mark as New
- Bookmark
- Subscribe
- Mute
- Subscribe to RSS Feed
- Permalink
- Report Inappropriate Content
Usually it was due to compiler's issue...compiler will generate optimized code sequence for performance consideration, that didn't match original source code's order. You can click on one source line then click "Assembly" button in source view of VTune, it will display assembly code for corresponding source line.
- Mark as New
- Bookmark
- Subscribe
- Mute
- Subscribe to RSS Feed
- Permalink
- Report Inappropriate Content
You may need options such as /debug:inline-debug-info
- Mark as New
- Bookmark
- Subscribe
- Mute
- Subscribe to RSS Feed
- Permalink
- Report Inappropriate Content
As @Peter said you should look at corresponding disassembled code of encoding function. Regarding the most time consumption line of code maybe it could accumulated wait time for the resources.
- Mark as New
- Bookmark
- Subscribe
- Mute
- Subscribe to RSS Feed
- Permalink
- Report Inappropriate Content
>>>Regarding the most time consumption line of code maybe it could accumulated wait time for the resources.>>>
@coolfat
You can check it by looking at Front-End stalls.
- Subscribe to RSS Feed
- Mark Topic as New
- Mark Topic as Read
- Float this Topic for Current User
- Bookmark
- Subscribe
- Printer Friendly Page
