- Mark as New
- Bookmark
- Subscribe
- Mute
- Subscribe to RSS Feed
- Permalink
- Report Inappropriate Content
Hi ,When I use the microarchitecture analysis in the command line command to collect data, I can't get the result of the assembly instruction using the report command.
Details as follows:
- The command to collect is as follows:
vtune -collect uarch-exploration -result-dir=/home/ningli/code/data/ -app-working-dir /home/ningli/cpu2017/bin -- /home/ningli/cpu2017/bin/runcpu --config=ning-try-base.cfg --tune=base --iterations=1 --size=test 519.lbm_r
- The resulting export command is as follows:
vtune -report hotspots -r /home/ningli/intel/vtune/projects/cpu2017_base_int_thread_1/r000ue -source-object function=S_regmatch -group-by=basic-block,address -column=block,source,function,instructions,assembly,cpi,address -source-search-dir=/home/ningli/cpu2017/benchspec/CPU/600.perlbench_s/build/ -report-knob show-issues=true -report-output /home/ningli/code/sole_system_x86_code/newResult/test/tset2.csv -format csv -csv-delimiter ,
I got the following error:
vtune: Executing actions 75 % Generating a report
vtune: Error: Source / assembly code for the selected object is not available.
vtune: Error: An internal error has occurred. Our apologies for this inconvenience. Please gather a description of the steps leading up to the problem and contact the Intel customer support team.
vtune: Executing actions 100 % done
vtune: Error: 0x40000023 (User input error)
But I have specified the path to the binary code, and the export command is entered according to the VTune user guide.
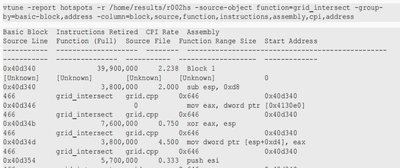
What should I do to get the following result with assembly code?
This is the result I want to get:
Link Copied
- Mark as New
- Bookmark
- Subscribe
- Mute
- Subscribe to RSS Feed
- Permalink
- Report Inappropriate Content
Hi,
Thank you for posting in Intel Communities.
We were able to reproduce this issue from our end and working on this internally.
One workaround(ssh Tunnel):
If you have a web browser on your machine you can try the below steps:
Establish an SSH connection to your server:
ssh -L 127.0.0.1:55001:127.0.0.1:55001 <user name of that server>@<IP>
eg: ssh -L 127.0.0.1:55001:127.0.0.1:55001 abc@192.114.2.18
Run Vtune-backend command as shown below:
vtune-backend --web-port=55001 --enable-server-profiling
after running the above command you can see the output as below:
(No TLS certificate was provided as a --tls-certificate command-line argument thus a self-signed certificate is generated to enable secure HTTPS transport for the webserver: /root/.intel/vtune/settings/certificates/middleware.crt.
Serving GUI at https://127.0.0.1:55001)
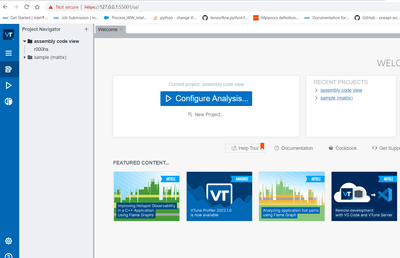
Now paste the URL link(eg :https://127.0.0.1:55001) on your web browser and ready to use Vtune GUI(after profiling your application you can view assembly code).
Thanks,
Jaideep
- Mark as New
- Bookmark
- Subscribe
- Mute
- Subscribe to RSS Feed
- Permalink
- Report Inappropriate Content
Hi,
Could you please let us know if the above provided workaround resolved your issue?
Thanks,
Jaideep
- Mark as New
- Bookmark
- Subscribe
- Mute
- Subscribe to RSS Feed
- Permalink
- Report Inappropriate Content
Hi,
We have not heard back from you. This thread will no longer be monitored by Intel. If you need further assistance, please post a new question.
Thanks,
Jaideep
- Mark as New
- Bookmark
- Subscribe
- Mute
- Subscribe to RSS Feed
- Permalink
- Report Inappropriate Content
Using your command line arguments for a micro-architecture exploration analysis results generates the following error in the latest vtune command line:
The following column filters were not matched: function, address.
Available values for '-column' option are:
Assembly
Source Line
Clockticks:Self
Instructions Retired:Self
..."
Using the following command line arguments did show assembly code:
vtune -report hotspots -r r007ue -source-object function=compress_file -group-by=basic-block,address -column=block,source,instructions,assembly,cpi
- Subscribe to RSS Feed
- Mark Topic as New
- Mark Topic as Read
- Float this Topic for Current User
- Bookmark
- Subscribe
- Printer Friendly Page

