- Mark as New
- Bookmark
- Subscribe
- Mute
- Subscribe to RSS Feed
- Permalink
- Report Inappropriate Content
Here is a problem ,
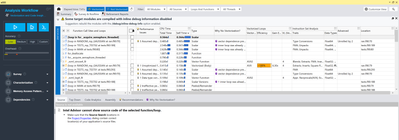
Intel Advisor cannot show source code of the selected function/loop
What happened and how to solve it?
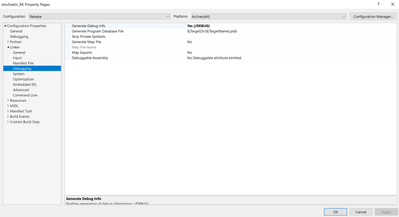
I seem to have already added the folder of my Fortran f90 files in the project properties.
Thank you very much in advance!
- Mark as New
- Bookmark
- Subscribe
- Mute
- Subscribe to RSS Feed
- Permalink
- Report Inappropriate Content
It looks like the selected function "for__acquire_semaphore_threaded" is not a function from the code of you application but a function from one of compiler libraries which was statically linked with your executable module. I found "for__acquire_semaphore_threaded" in libifcoremt.lib which is a part of Intel compiler on my system. Such libraries are usually distributed without debugging information. That is why Advisor can't show source code for this function.
Link Copied
- Mark as New
- Bookmark
- Subscribe
- Mute
- Subscribe to RSS Feed
- Permalink
- Report Inappropriate Content
Hi,
Thank you for posting in Intel Communities. We could reproduce your issue. We're working on it internally. We'll get back to you with an update. Meanwhile we would like you to provide some information about your project:
1) The project you're working on and steps to reproduce.
2) Your OS details
Regards,
Alekhya
- Mark as New
- Bookmark
- Subscribe
- Mute
- Subscribe to RSS Feed
- Permalink
- Report Inappropriate Content
Sure thank you so much! The whole project is attached. Please check.
To Denis_M_Intel, I think I enabled debug info, please see screen shot below. Anyway, the project is attached, you could check. Thank you very much!
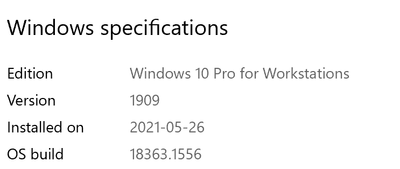
OS is windows 10 1909 as below,
- Mark as New
- Bookmark
- Subscribe
- Mute
- Subscribe to RSS Feed
- Permalink
- Report Inappropriate Content
It looks like there is no debugging information for this function. Can you check that the module it belongs to has debug info? If the module has .pdb file, make sure its path is added to the Binary/Symbol search locations (Binary/Symbol and Source Search Order (intel.com)).
- Mark as New
- Bookmark
- Subscribe
- Mute
- Subscribe to RSS Feed
- Permalink
- Report Inappropriate Content
It looks like the selected function "for__acquire_semaphore_threaded" is not a function from the code of you application but a function from one of compiler libraries which was statically linked with your executable module. I found "for__acquire_semaphore_threaded" in libifcoremt.lib which is a part of Intel compiler on my system. Such libraries are usually distributed without debugging information. That is why Advisor can't show source code for this function.
- Mark as New
- Bookmark
- Subscribe
- Mute
- Subscribe to RSS Feed
- Permalink
- Report Inappropriate Content
Hi,
Has the solution provided helped? Could you please give us an update regarding this issue?
Regards,
Alekhya
- Mark as New
- Bookmark
- Subscribe
- Mute
- Subscribe to RSS Feed
- Permalink
- Report Inappropriate Content
- Mark as New
- Bookmark
- Subscribe
- Mute
- Subscribe to RSS Feed
- Permalink
- Report Inappropriate Content
Hello,
Just to elaborate more on this semaphore function from libifmcoremt library:
1) If needed, in Advisor, you can filter/choose your module of interest using Advisor's Filter by Module:
2) This function was prioritized by Advisor, because it is most time consuming "leaf" function with largest "Self Time" in your application, directly invoked by your ("user") code. It is so called "user+1" level function. To understand where it is invoked for (in which context and why it is used) - you can open "Top-Down" tab, while having given function selected in the upper view:
- Mark as New
- Bookmark
- Subscribe
- Mute
- Subscribe to RSS Feed
- Permalink
- Report Inappropriate Content
Hi,
Thank you for accepting our solution. If you need any additional information, please post a new question as this thread is no longer monitored by Intel.
Regards,
Alekhya
- Subscribe to RSS Feed
- Mark Topic as New
- Mark Topic as Read
- Float this Topic for Current User
- Bookmark
- Subscribe
- Printer Friendly Page


