- Mark as New
- Bookmark
- Subscribe
- Mute
- Subscribe to RSS Feed
- Permalink
- Report Inappropriate Content
(i am refering this)
i can do source analysis with Callgrind (a different profiler)
Vtune Version:
[master-andreas@master-pc ~]$ ls /opt/intel/oneapi/vtune
2021.2.0 latest
GCC version
[master-andreas@master-pc ~]$ gcc --version
gcc (GCC) 10.2.0
my program was complied with:
set(CMAKE_CXX_FLAGS "-g3")
set(CMAKE_CXX_FLAGS "-shared-libgcc")
cmake -DCMAKE_BUILD_TYPE=RelWithDebInfo
and run with:
vtune -collect hotspotsmy cpu:
[master-andreas@master-pc ~]$ lscpu
Model name: Intel(R) Core(TM) i3-6006U CPU @ 2.00GHz
if you need more info i can provide anything
Link Copied
- Mark as New
- Bookmark
- Subscribe
- Mute
- Subscribe to RSS Feed
- Permalink
- Report Inappropriate Content
Hi ,
Thank you for posting in Intel Analyzers Forum.
Intel® VTune™ Profiler provides accurate source analysis if your code is compiled with the debug information and debug information is written correctly in the binary file (for Linux* targets). We could see that you have given the -g3 flag.
We tried running sample matrix application in our linux machine and was able to view the source code. Please follow the below steps and see if source code is showing or not.
1. cd /opt/intel/oneapi
2. source setvars.sh
3. cd vtune/2021.1.1/samples/en/C++/matrix/linux
4. Run make all
5. cd ..
6. You will find matrix executable there If the compilation was successful
7. Vtune -collect hotspots ./matrix
8. Result folder r00XX will be created after the execution
9. Open the result .vtune file in gui and see whether you can see the source code by right clicking on the function under “bottom-up” tab and select “view source code” [ screenshot attached ]
Open the Makefile and edit the part where they have given -g as flag and change it to -g3. Try the above same steps and see whether you are getting the source code.
Could you please confirm whether you are trying this is linux machine and launching vtune in same machine. Have you copied the result folder to somewhere else and opened that in vtune gui ? In such cases , you might face this issue of not seeing source code.
Also, please share the screenshot of you vtune-gui result window.
Hope this helps.
Regards,
Raeesa
- Mark as New
- Bookmark
- Subscribe
- Mute
- Subscribe to RSS Feed
- Permalink
- Report Inappropriate Content
1)
i run what you told and it worked (with a couple of minor modification that should not matter)
3. cd vtune/2021.2.0/samples/en/C++/matrix/linux
7. vtune -collect hotspots ./matrix
it also worked with '-g3' instead of '-g'
@RaeesaM_Intel wrote:
Have you copied the result folder to somewhere else and opened that in vtune gui ? In such cases , you might face this issue of not seeing source code.
i have never used 'cp' or 'mv'
i have tried the 2 following things:
1) run the executable from the vtune-gui
2) run the executable directly with vtune from the directory of the executable
update: i have cleaned my build folder and tried again
and this time view_source is malfunctioning
ie i select view source on a file it give me back a different source file from the one i have picked (usally from libc++) e.g. stl_vector.h
i have uploaded the zip of that run ('r002hs.zip')
you can try my code with
sudo apt install libboost-dev libyaml-cpp-dev #if you are on ubuntu
git clone git@github.com:stavrosgreece/multiagentlearning.git
cd multiagentlearning
wget https://download.pytorch.org/libtorch/cpu/libtorch-cxx11-abi-shared-with-deps-latest%2Bcpu.zip
unzip libtorch-cxx11-abi-shared-with-deps-latest+cpu.zip
rm libtorch-cxx11-abi-shared-with-deps-latest+cpu.zip
mkdir build && cd build
cmake -DCMAKE_BUILD_TYPE=RelWithDebInfo .. && make #this may take a few mins
you will wanna modify the default config.yaml (vim ../config.yaml) to make it finish in less that one minute
ES/Epoch and set it to 1 (line 17)
finnaly (assuming you are still in ./build) run it with:
vtune -collect hotspots ./testWarehouse -c ../config.yaml -t 6
(-t specifies number of threads)
- Mark as New
- Bookmark
- Subscribe
- Mute
- Subscribe to RSS Feed
- Permalink
- Report Inappropriate Content
Hi,
Thank you for sharing all the necessary details and steps. We are trying to reproduce your issue from our end. Could you please confirm the boost library version. We are facing some issue in the cmake step. Also, you please share the entire folder which has the executable files and result folder.
Regards,
Raeesa
- Mark as New
- Bookmark
- Subscribe
- Mute
- Subscribe to RSS Feed
- Permalink
- Report Inappropriate Content
[master-andreas@master-pc ~]$ pacman -Q | grep boost
boost 1.75.0-3
boost-libs 1.75.0-3
Also i have attached the whole directory to this link
all you need to do is
cd .../multiagentleanring/build
cmake -DCMAKE_BUILD_TYPE=RelWithDebInfo .. && make
#this may take a few mins
(if CMake still fails (or the rest of make)
then i also include the pre-complied exec file 'testWarehouse')
then run it with:
vtune -collect hotspots ./testWarehouse -c ../config.yaml
Example of an bug when selecting view source Warehouse_ES_Container::evolution_strategy it returns the source of allocator.h (the file containing the c++ malloc among other things)
- Mark as New
- Bookmark
- Subscribe
- Mute
- Subscribe to RSS Feed
- Permalink
- Report Inappropriate Content
Hi,
Thank you for sharing more details. We tried running the analysis on the pre compiled executable file you shared :
source /opt/intel/oneapi/setvars.sh [ 2021.2 ]
cd multiagentlearning/build/
vtune -collect hotspots ./testWarehouse -c ../config.yaml
We are facing some issues in viewing the source code and are checking this internally with the team. We would get back to you once we are able to reproduce your issue. Meanwhile could you please try adding the path of executable file in “search binaries option” in VTune GUI:
open the result in VTune >> click on analysis configuration tab >> at the bottom you can find the search binaries option [screenshot attached ] >> Add path of possible locations of binary and symbol files >> click OK
Also, please confirm whether you were able to see the source code of matrix application after running the analysis or just the analysis worked.
Regards,
Raeesa
- Mark as New
- Bookmark
- Subscribe
- Mute
- Subscribe to RSS Feed
- Permalink
- Report Inappropriate Content
@RaeesaM_Intel wrote:
open the result in VTune >> click on analysis configuration tab >> at the bottom you can find the search binaries option [screenshot attached ] >> Add path of possible locations of binary and symbol files >> click OK
this did not help
"Also, please confirm whether you were able to see the source code of matrix application after running the analysis or just the analysis worked."
The matrix mul just worked
- Mark as New
- Bookmark
- Subscribe
- Mute
- Subscribe to RSS Feed
- Permalink
- Report Inappropriate Content
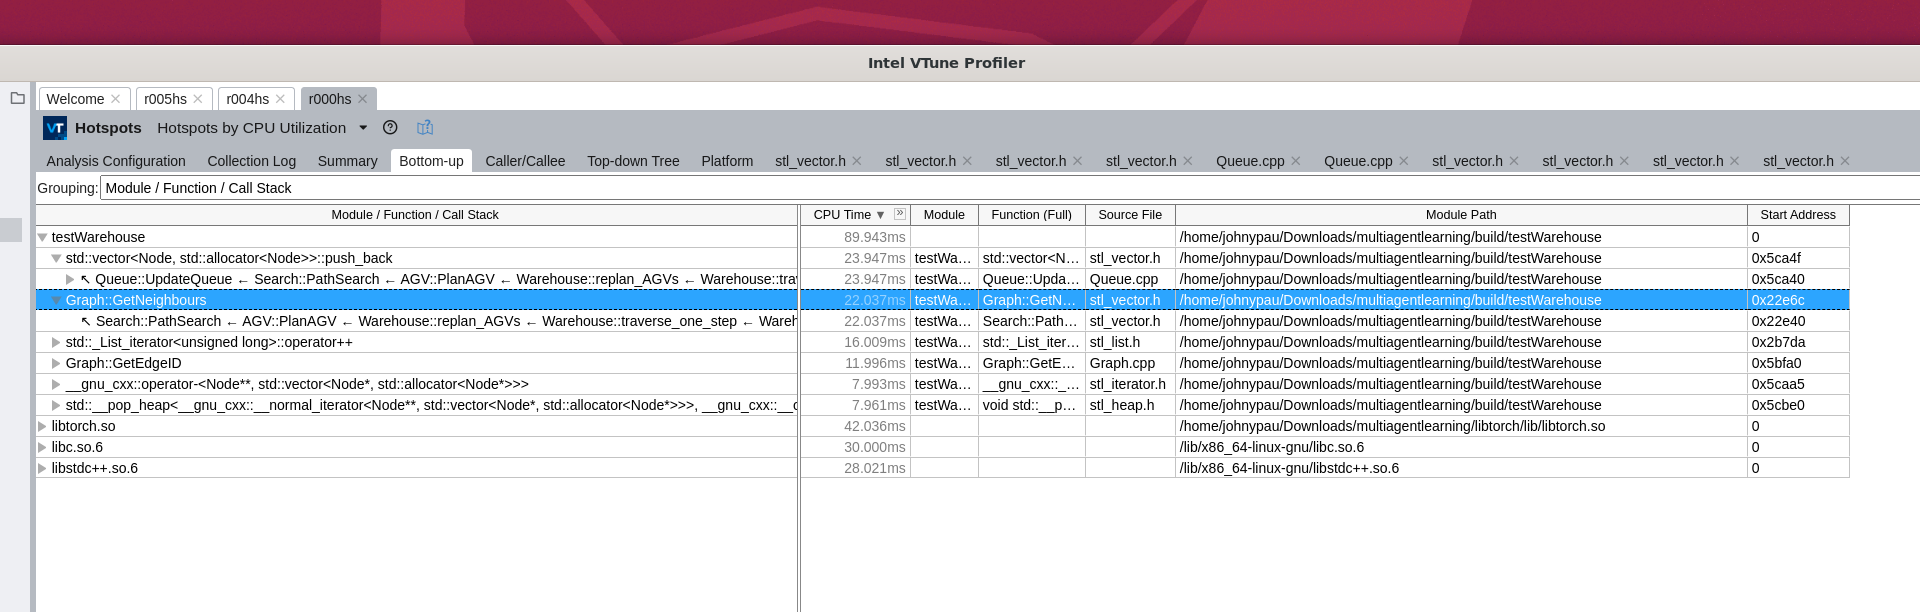
Hi,
We were able to reproduce the issue from our end. Would like to confirm again with you whether you are facing this same issue.
ie when we select view source on a file ( eg: Graph::getNeighbours ) Vtune GUI shows another source file ( eg : stl_vector.h )
[ See the attached screenshot ]
please confirm so that we can debug and solve the issue at the earliest.
Regards,
Raeesa
- Mark as New
- Bookmark
- Subscribe
- Mute
- Subscribe to RSS Feed
- Permalink
- Report Inappropriate Content
This issue is currently being investigated and a fix is expected soon. We will get back to you once a fix is available.
Regards,
Johny.
- Mark as New
- Bookmark
- Subscribe
- Mute
- Subscribe to RSS Feed
- Permalink
- Report Inappropriate Content
This issue has been fixed in the 2021.6.0 release of VTune profiler. You can download this version here: https://software.intel.com/content/www/us/en/develop/articles/oneapi-standalone-components.html
Please let us know if the fix resolved your issue.
Regards,
Johny.
- Mark as New
- Bookmark
- Subscribe
- Mute
- Subscribe to RSS Feed
- Permalink
- Report Inappropriate Content
This issue has been resolved and we will no longer respond to this thread. If you require additional assistance from Intel, please start a new thread. Any further interaction in this thread will be considered community only
- Subscribe to RSS Feed
- Mark Topic as New
- Mark Topic as Read
- Float this Topic for Current User
- Bookmark
- Subscribe
- Printer Friendly Page