- Mark as New
- Bookmark
- Subscribe
- Mute
- Subscribe to RSS Feed
- Permalink
- Report Inappropriate Content
Hi,
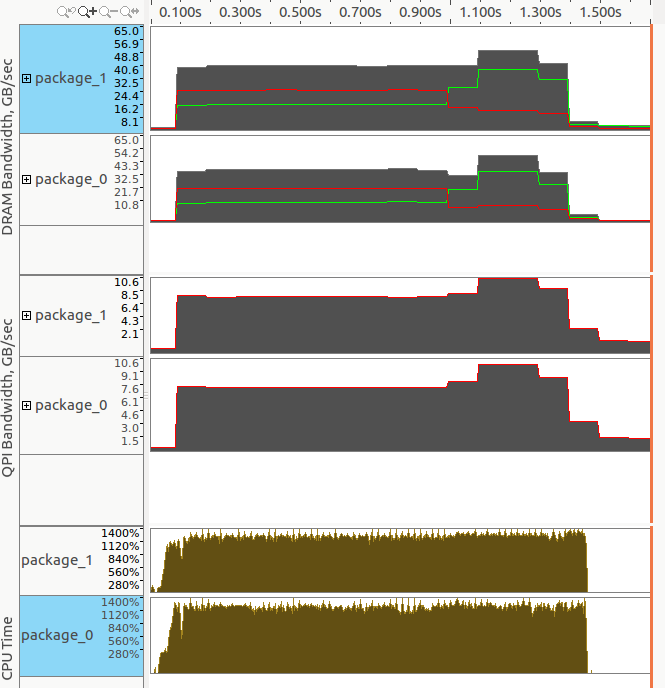
I wrote this short program to understand how memory access analysis and NUMA works. I am running a Dual-Xeon E5-2660v4. I am surprised to see that the QPI is heavily used despite the fact that my program is using the first touch policy. Can anyone explain me why there is so much traffic here?
int main() {
  int n = 1000000000;

  double* a = new double;
  double* b = new double;
  double* c = new double;
#pragma omp parallel for
  for (int k = 0; k < n; ++k) {
      a = 0.0;
      b = 0.0;
      c = 0.0;
  }

#pragma omp parallel for
  for (int k = 0; k < n; ++k) {
      a = b + c;
  }

  delete[] c;
  delete[] b;
  delete[] a;

  return 0;
}
Link Copied
- Mark as New
- Bookmark
- Subscribe
- Mute
- Subscribe to RSS Feed
- Permalink
- Report Inappropriate Content
Did you analyze with and without setting OMP_PLACES=cores, num_threads = omp_num_places ?
- Mark as New
- Bookmark
- Subscribe
- Mute
- Subscribe to RSS Feed
- Permalink
- Report Inappropriate Content
Tim P. wrote:
Did you analyze with and without setting OMP_PLACES=cores, num_threads = omp_num_places ?
I have tried. But what is interesting is that the "Remote/Local DRAM ratio" is equal to 0 in the Summary page. As a consequence, I would think that there should be nothing going through the QPI.
If I don't use the first touch policy, the "Remote/Local DRAM ratio" is equal to 0.87 and the program is much slower (as expected).
The question is: What is going through the QPI when I use the first touch policy?
- Mark as New
- Bookmark
- Subscribe
- Mute
- Subscribe to RSS Feed
- Permalink
- Report Inappropriate Content
The details of the QPI traffic depend on the "snoop mode" of the system, but I don't think that Intel has ever described the QPI protocols in enough detail that it would be possible to predict the traffic in detail. (One can learn a fair amount about QPI by studying the uncore performance monitor guide, but it requires a lot of experience to interpret....)
At a high level, what you are seeing on the QPI is snoops and snoop responses. Picking some numbers off the charts suggests that you are moving about 50 GB/s per chip, or ~100 GB/s aggregate. This corresponds to 1.56 billion cache lines per second. The QPI traffic shows about 10 GB/s on each link during the same period, or ~20 GB/s aggregate. 20 GB/s / 1.56 Glines/sec is about 13 Bytes/line. I would need to look at real numbers instead of the graph to know how "fuzzy" this number is, and I would want to test with different combinations of reads and writes (and non-temporal writes) to try to infer whether the number of bytes of coherence traffic is different for these different transactions.
I have not looked at the QPI counters on Xeon E5 v4 yet, but many of the events are broken badly on Xeon E5 v1 and Xeon E5 v3, so Intel may have been forced to use a QPI event that does not measure exactly what they want here.
- Mark as New
- Bookmark
- Subscribe
- Mute
- Subscribe to RSS Feed
- Permalink
- Report Inappropriate Content
Hello,
Could you please try to export KMP_AFFINITY=compact and re-measure the results?
Experimenting on BDW-EP box with the code provided I see that with default OpenMP parameters worker threads are a kind of randomly assigned for hardware logical cores and moreover not necessarily pinned to cores. As a result there is QPI data traffic in computational part (cannot explain why VTune remote/all ratio is 0 in this case).
If I use affinity - then QPI traffic in computational part is almost negligible and there is only some small QPI snoop traffic during initialization phase.
Thanks & Regards, Dmitry
- Mark as New
- Bookmark
- Subscribe
- Mute
- Subscribe to RSS Feed
- Permalink
- Report Inappropriate Content
Hi,
Here is the result with "export KMP_AFFINITY=compact". I have changed the code so we can see side by side the usage of first touch policy and what happen if we don't use it. Here is the code:
#include <chrono>
#include <cstdio>
#include <vector>

int main() {
  int n = 1000000000;

  double* a = new double;
  double* b = new double;
  double* c = new double;
#pragma omp parallel for
  for (int k = 0; k < n; ++k) {
    a = 0.0;
    b = 0.0;
    c = 0.0;
  }

  auto begin = std::chrono::high_resolution_clock::now();
#pragma omp parallel for
  for (int k = 0; k < n; ++k) {
    a = b + c;
  }
  auto end = std::chrono::high_resolution_clock::now();
  double time =
      1.0e-9 *
      std::chrono::duration_cast<std::chrono::nanoseconds>(end - begin).count();
  std::printf("   With first touch policy: %7.2f\n", time);

  delete[] c;
  delete[] b;
  delete[] a;

  std::vector<double> va(n, 0.0);
  std::vector<double> vb(n, 0.0);
  std::vector<double> vc(n, 0.0);

  begin = std::chrono::high_resolution_clock::now();
#pragma omp parallel for
  for (int k = 0; k < n; ++k) {
    va = vb + vc;
  }
  end = std::chrono::high_resolution_clock::now();
  time =
      1.0e-9 *
      std::chrono::duration_cast<std::chrono::nanoseconds>(end - begin).count();

  std::printf("Without first touch policy: %7.2f\n", time);

  return 0;
}
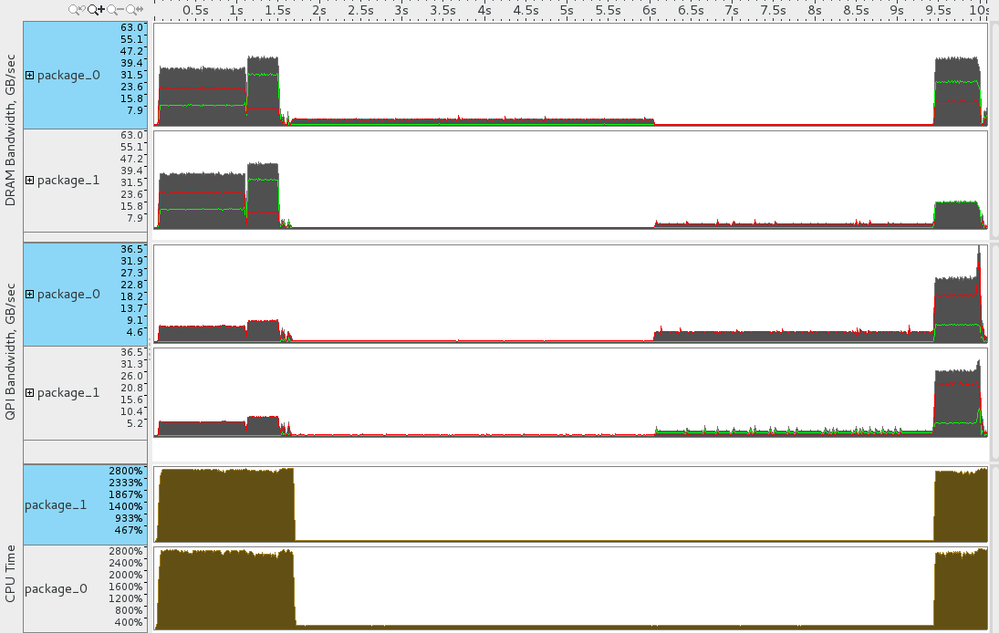
and the result of the memory analysis. We can see a QPI bandwidth around 9 GB/s in the first computational phase which is using the first touch policy. I agree that it is way lower than what we have in the second phase. But what is it ?
I am puzzled because I thought that I could use this QPI graph to check for NUMA problems, but it seems that we can't use it for that.
- Mark as New
- Bookmark
- Subscribe
- Mute
- Subscribe to RSS Feed
- Permalink
- Report Inappropriate Content
It would be very helpful to have the code print the wall time at the beginning/end of each section so that it is possible to correlate the various sections of the VTune trace to the corresponding sections of the code.
VTune is limited to measuring what the hardware counters measure, and many of the events are broken. Without knowing exactly what configuration bits VTune is setting, it is impossible to know what to expect.
- Mark as New
- Bookmark
- Subscribe
- Mute
- Subscribe to RSS Feed
- Permalink
- Report Inappropriate Content
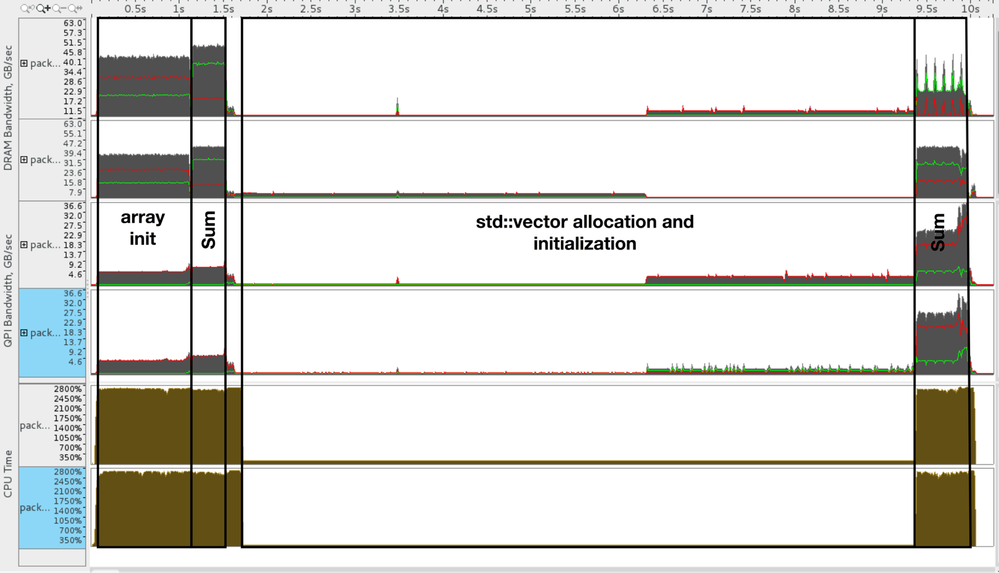
Hi John. Here is the annotated timeline. I have 32 GB of RAM on this computer (16 GB on each socket) and as the 3 vectors use 24 GB of RAM, that explains the fact that some of the memory commited for std::vector are not commited on the original bank. It explains the QPI communication during the initialization of the std::vector.
- Mark as New
- Bookmark
- Subscribe
- Mute
- Subscribe to RSS Feed
- Permalink
- Report Inappropriate Content
The first "sum" section shows about 45 GB/s of DRAM bandwidth on each package and somewhere in the 5-6 GB/s range of QPI bandwidth on each package. This is a little bit lower than what I saw in your results previously, but not by a huge amount.
The real question here is "what are the QPI counters programmed to count?" There are many different QPI events (as described in the Xeon E5 v4 Uncore Performance Monitoring Guide, document 334291-001) -- some of these count only data packets, some count data packets plus their associated header packets, some count commands, some count snoops, some count snoop responses, etc, etc, etc.... To use this for studying NUMA effects, one would like to have the counters only increment for data packets. I have not had a chance to check these events on Xeon E5 v4, but on Xeon E5 v3 a large number of these events are badly broken. So it is at least *possible* that VTune is forced to use an event that counts more than just data in order to get useful results. If this is the case, the results are consistent with transferring zero data over QPI, but counting about 8 Bytes of "other" traffic per local cache line transfer. This could be a read request or a snoop (depending on the snoop mode that the system is booted in), or a snoop response -- it would take a modest number of experiments to pin this down.
If you have administrator rights on the system, it might be helpful to pause the VTune job somewhere in the middle and read the QPI configuration registers (as described in Section 2.9 of the Xeon E5 v4 Uncore Performance Monitoring Guide) to see what VTune is using to measure "QPI Bandwidth". These are QPI configuration space registers, which can be read easily using the "lspci" command on Linux systems. Understanding the results is not easy at all, and there is no guarantee that what VTune calls "QPI Bandwidth" is even measured using the QPI counters -- similar information on remote accesses can be inferred from counters in the L3 (CBo units) and Home Agent.
- Subscribe to RSS Feed
- Mark Topic as New
- Mark Topic as Read
- Float this Topic for Current User
- Bookmark
- Subscribe
- Printer Friendly Page


