- 新着としてマーク
- ブックマーク
- 購読
- ミュート
- RSS フィードを購読する
- ハイライト
- 印刷
- 不適切なコンテンツを報告
Hello,
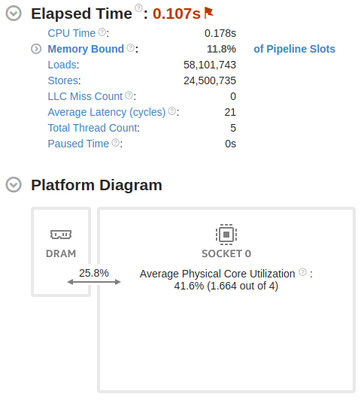
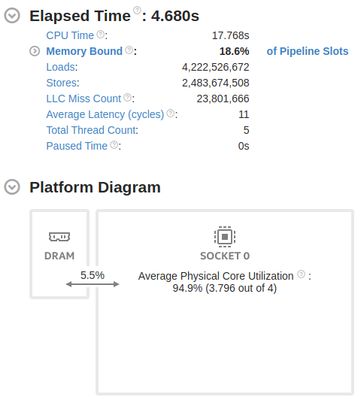
I wrote a code with 4 threads on a i5-6600 CPU which simply accesses a large array with strides. The parameter I change, is the stride size. I expect that the run with large stride, creates more memory accesses due to less locality. In the pictures below, you can see the output of two runs with large and small strides.
The question is why the run with longer execution time (also larger LLC misses) has more core utilization? 94% vs. 41%.
Also the DRAM bandwidth for the longer executed run is less than the other. I expect the reverse. Any idea about that?
コピーされたリンク
- 新着としてマーク
- ブックマーク
- 購読
- ミュート
- RSS フィードを購読する
- ハイライト
- 印刷
- 不適切なコンテンツを報告
Hi,
Thank you for posting in Intel Communities. Could you please provide us the answers to our below doubts so that we can debug your issue further?
- Details about your application you attached to VTune Profiler.
- Sample Reproducer i.e. the code which you've written and all the command to compile and analyze.
- How did you spawn the threads?
Regards,
Alekhya
- 新着としてマーク
- ブックマーク
- 購読
- ミュート
- RSS フィードを購読する
- ハイライト
- 印刷
- 不適切なコンテンツを報告
Hello,
I have attached the code. A sample run command is `./a.out 4000000000 4 10 4000000`. The first number is the array size, the second is the thread number, the third is the stride and the fourth is the number of accesses.
The compilation command is a standard gcc command with -O3.
I don't know what you mean by "the way threads are spawn". The code uses standard pthread library.
- 新着としてマーク
- ブックマーク
- 購読
- ミュート
- RSS フィードを購読する
- ハイライト
- 印刷
- 不適切なコンテンツを報告
Hi,
Glad to know that your issue is resolved. Thanks for letting us know. If you need any further assistance, please post a new question as this thread will no longer be monitored by Intel.
Regards,
Alekhya

