- Mark as New
- Bookmark
- Subscribe
- Mute
- Subscribe to RSS Feed
- Permalink
- Report Inappropriate Content
I'm trying to using VTune's GPU In-Kernel Profiling feature in order to determine optimize an OpenCL kernel running on an Intel GPU (the HD Graphics 620 built into an i5-7300U.)
I initially installed VTune Amplifier 2019 Update 3, but then realized that apparently OpenCL GPU in-kernel profiling has been temporarily removed as of that update "to address some defects" (according to a note in the Intel docs here: https://software.intel.com/en-us/vtune-amplifier-help-gpu-in-kernel-profiling).
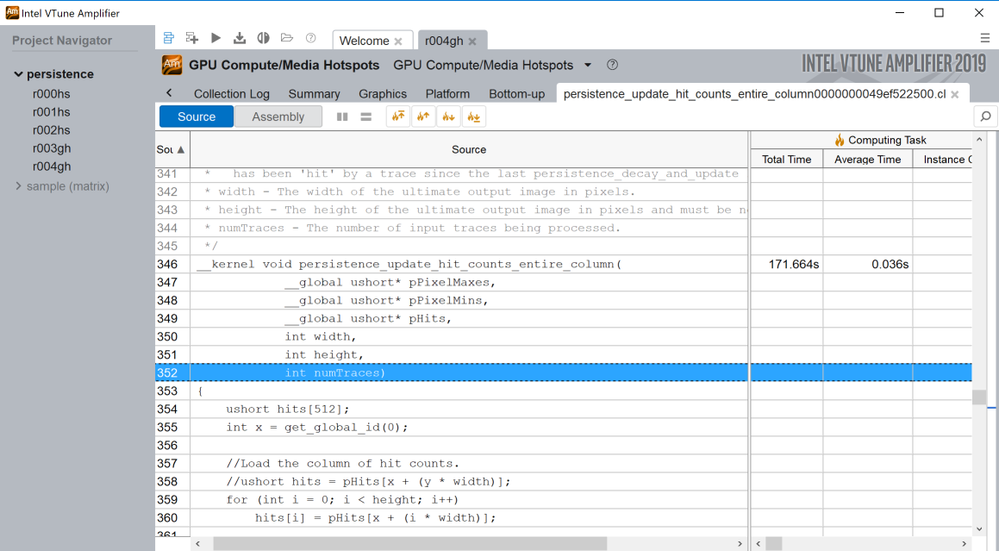
Since it was removed from that version, I uninstalled it and installed 2019 Update 2 instead. I can now get the in-kernel profiling feature to launch and display the source code properly, but all of the time for the kernel is being displayed on the line that contains only the kernel declaration. Obviously, that's not particularly helpful for optimizing the kernel.
Here's a screenshot of what I'm seeing with the first few lines of the kernel, but none of the other lines of the kernel show any time, either. Only the kernel declaration line shows any time (and it's the total execution time for the kernel.)
Is this a known bug in VTune Amplifier 2019 Update 2 or am I just doing something wrong? Is there something in particular I need to enable in order to get the profiler to have line-by-line resolution on the execution times rather than only showing total execution time for the entire kernel?
- Mark as New
- Bookmark
- Subscribe
- Mute
- Subscribe to RSS Feed
- Permalink
- Report Inappropriate Content
Hi Ross,
GPU In-kernel Profiling analysis is still available in VTune Amplifier 2019 Update 2. And based on the name of your result 'r004gh' you have run GPU Compute/Media Hotspots analysis. By default, results for GPU In-kernel Profiling analysis have 'gp' suffix. Please ensure that correct analysis type is selected.
Thanks.
Link Copied
- Mark as New
- Bookmark
- Subscribe
- Mute
- Subscribe to RSS Feed
- Permalink
- Report Inappropriate Content
Also, if this is a known issue with VTune Amplifier 2019 Update 2 rather than some mistake I'm making, are there any versions of VTune Amplifier currently available for download where in-kernel profiling works correctly?
- Mark as New
- Bookmark
- Subscribe
- Mute
- Subscribe to RSS Feed
- Permalink
- Report Inappropriate Content
Hi Ross,
GPU In-kernel Profiling analysis is still available in VTune Amplifier 2019 Update 2. And based on the name of your result 'r004gh' you have run GPU Compute/Media Hotspots analysis. By default, results for GPU In-kernel Profiling analysis have 'gp' suffix. Please ensure that correct analysis type is selected.
Thanks.
- Mark as New
- Bookmark
- Subscribe
- Mute
- Subscribe to RSS Feed
- Permalink
- Report Inappropriate Content
You're right, that was it. I didn't even notice it was a separate option there (probably because it wasn't there when I was first looking at that screen on Update 3.) It's working now, thanks!
- Subscribe to RSS Feed
- Mark Topic as New
- Mark Topic as Read
- Float this Topic for Current User
- Bookmark
- Subscribe
- Printer Friendly Page
