- Mark as New
- Bookmark
- Subscribe
- Mute
- Subscribe to RSS Feed
- Permalink
- Report Inappropriate Content
Hi
I'd like to restrict analysis is 3 ways. By this, I mean the collection of data. Nit the resulting report
1) I have a DLL that is loaded by an external process. I only want to analyse the code in the DLL. The overhead of the external program is so large that Amplifier grind to a halt. I'm not interested in what the main program does (yet).
2) I'd like to analyse only parts of the DLL. I've implemented the itt API. But with limited results. I've tried pause/resume, tasks and events.
3) I'd like to restrict analysis to only one thread and exclude analysis from everything else. Which itt API call is the appropriate one.
Any help gratefully received.
Steve
Link Copied
- Mark as New
- Bookmark
- Subscribe
- Mute
- Subscribe to RSS Feed
- Permalink
- Report Inappropriate Content
I assume that you launched a program, which created another process (or manually launching this) - this extra process is huge and you wont profile this whole program (but want to profile a DLL loaded by this process).
1. You can use system profile like - "amplxe-cl -c advanced-hotspots -analyze-system -- 1st-program". Thus, all active processes will be profiled. However, stack sampling is not supported.
2. You may use like - "amplxe-cl -c advanced-hotspots -knob collection-detail=stack-sampling -start-paused -target-process PID -duration 60" ; You can manually launch 1st-program, then wait 2nd process created to run command. You have to write ITT Pause/Resume in your DLL.
3. You might add workload in your dll, thus, VTune can collect performance data in functions of your interest. Or, you may change sample interval (default is 1000 per second for advanced-hotspots), please refer to this article, and note stack sampling option is "-knob enable-stack-collection=true"
4. If you use same code for many threads, and only want to analyze one thread - you may check thread id then annotate ITT API. Also, you can filter result in report by using "-group-by thread" to separate data.
- Mark as New
- Bookmark
- Subscribe
- Mute
- Subscribe to RSS Feed
- Permalink
- Report Inappropriate Content
Hi Peter
Thanks for replying. Your suggestions seem to imply that I am launching 2 processes. This is not the case. There is a single program. This program loads my DLL and then creates a single thread that calls into my DLL. I simply want to restrict analysis to this thread and code within the DLL.
Is this possible?
Cheers
Steve
- Mark as New
- Bookmark
- Subscribe
- Mute
- Subscribe to RSS Feed
- Permalink
- Report Inappropriate Content
@Steve
>I have a DLL that is loaded by an external process...
What I misunderstood is "external process", actually your "external" meant for dll from process. In my view, both process & dll are in same memory space:-)
That will be so simple, do like - "amplxe-cl -c advanced-hotspots -knob collection-detail=stack-sampling search-dir=dll-path -start-paused -- your-program".
VTune Amplifier will launch your application but not collect data, until your Dll code is loaded and meet ITT resume code in DLL.
__itt_resume() & __itt_pause() will be used; you hope to profile code range
You need to add - #include "ittnotify.h" in DLL's source file, use below to build
-I/opt/intel/vtune_amplifier_xe_2016/include
/opt/intel/vtune_amplifier_xe_2016/lib64/libittnotify.a, should be linked
Cheers, Peter
- Mark as New
- Bookmark
- Subscribe
- Mute
- Subscribe to RSS Feed
- Permalink
- Report Inappropriate Content
@BatterseaSteve,
The short answer is, no. There is no way to limit data collection to one thread in one module during collection.
As Peter has said, and you have already tried, you can limit *when* data is collected.
But, let's back up. In your original post, you say, "The overhead of the external program is so large that Amplifier grind to a halt." First, *what* analysis are you using? Second, what do you mean by "overhead of the external program"? Are you setting the "Estimated time duration" in the project properties (i.e., "Choose Target" window)? How long does your app execute with said workload? If you place an __itt_resume() when the DLL is initialized and an __itt_pause() when it is being unloaded (or sooner, if that is desired), are you not able to limit collection to the processing you are interested in? Then, after the data is processed by VTune Amplifier, you can limit the display to a single thread using the "Filter In" functionality of either the grid or the timeline.
- Mark as New
- Bookmark
- Subscribe
- Mute
- Subscribe to RSS Feed
- Permalink
- Report Inappropriate Content
Hi Peter/MrAnderson.
I am trying to do a specific thing. Our code within the DLL runs fine for 95% of the time. Every once in a while we see a 'spike' in performance. Code that normally complete in < 10msecs can halt for anything upto 500msecs. This happens 2-3 times over a 12 hour period during a test run. We do not see this if we run the DLL in a test harness. What I would like to do is isolate this spike to determine what the cause is. The program is running OpenGL/Cuda as well as regular c++ code. We have used GL/Cuda tools and they indicate that the problem is CPU based. So we have turned to vTune.
If I launch the main program through Amplifier in VS2010 the machine (for some reason) locks up. The main program creates a huge number of threads. I have tried basic hotspot and advanced hotspot so far with similar results. I increased the CPU sampling from 1msec to 10msec.
The command line fro VS2010 is:
"C:\Program Files (x86)\Intel\VTune Amplifier XE 2015\bin32\amplxe-cl" -collect advanced-hotspots -knob sampling-interval=10 -knob collection-detail=stack-sampling -knob event-mode=user -knob enable-user-tasks=true -knob enable-gpu-usage=false -knob gpu-counters-mode=none -knob enable-gpu-opencl=false -no-follow-child -mrte-mode=auto -target-duration-type=long -no-analyze-system -data-limit=0 -slow-frames-threshold=40 -fast-frames-threshold=100 --search-dir sym=C:\tog\tog_4.6.2.Snell\build\code\RT_OEM\dll_build\Release --search-dir sym=C:\blah blah\dll_build --target-process MAINPROG.exe
I specify an The only way I can get any results at all is if I attach to process. When I do this with 'Analyze User tasks' checked I get an error when the collection starts saying
"Collection of User API tasks cannot be performed for Profile System or Attach to Process."
So I tried running from the command line. I use pause/resume to start and stop the collection around the calls into my DLL. This does at least run up and I see messages printed saying it is pausing/resuming. However, the mainprogram starts but then quickly grinds to a halt and locks the machine up. I have no idea why or how to find out why.
Is there an overhead in pause/resume? Is it reasonable to be doing this every 40msecs? The problem is still that when I resume it is scoping the whole process - not just the thread it is called from.
Cheers
Steve
- Mark as New
- Bookmark
- Subscribe
- Mute
- Subscribe to RSS Feed
- Permalink
- Report Inappropriate Content
I understand that you created huge number threads, but only want to know performance data in one thread. Mr.Anderson suggested to profile whole process then you can filter data by selected thread in bottom-up report. If you think that your program is huge to cause many overhead (profiled by VTune) to lock up system. Another approach is to do system profile - "amplxe-cl -c advacnced-hotspots -d 30", you have to ensure your application starts up and dll is called during 30 seconds. If your workload of dll is tiny, you need to reduce sampling-interval value to 0.1-0.01 ("normally complete in < 10msecs ") to capture more samples. Duration should be short, so result file is not large.
I don't think that you need to use enable -user-tasks. If you had problem to use Pause/Resume API on your side, 40ms for code scope? You can try VTune Amplifier XE 2016 Update 1, set below then try VTune:
export AMPLXE_LOG_LEVEL=TRACE
export AMPLXE_LOG_DIR=<dir>
Please attach logs for investigating. (Your application is extra huge, so attach running process also has extra cost...but I need your logs as evidences). So, system profiling might be a temp workaround.
- Mark as New
- Bookmark
- Subscribe
- Mute
- Subscribe to RSS Feed
- Permalink
- Report Inappropriate Content
Hi Peter
OK
What does the -d do?
Is there an additional overhead running VS2010 vs Stand alone Amplifier GUI ve Command line?
Which logs are you asking for - the output from the analysis?
I find that I can run the application if I select Basic Hotspots and set sample interval to 15msec. However, the overhead of vTune knocks the system out of realtime. The app does not crash. If I run advanced hotspots with sample of 10msec the machine crashes and restarts.
Cheers
Steve
- Mark as New
- Bookmark
- Subscribe
- Mute
- Subscribe to RSS Feed
- Permalink
- Report Inappropriate Content
"realtime"? You said, Windows*, right? Windows and "realtime" don't go together. What version of Windows are you running on?
The command Peter suggested, "amplxe-cl -c advanced-hotspots -d 30", will just verify that the hardware-based sampling collector works on your system, since you say the system crashes whenever you try Advanced Hotspots. By removing your app from the equation, we can validate the VTune Amplifier. Also, I suggest this command: 'amplxe-cl -c advanced-hotspots -d 5 -r c:\temp\r@@@'.
The -d is the duration - collect for 5 seconds. The -r is the results directory, where @@@ is automatically incremented by VTune Amplifier so that it does not try to write an already existing directory. Without -r, VTune Amplifier attempt to create a subdirectory in the current directory. If you just open the command prompt from the Parallel Studio XE start menu, then you will execute that command in a protected directory and it will fail.
Please try that command and report your results.
- Mark as New
- Bookmark
- Subscribe
- Mute
- Subscribe to RSS Feed
- Permalink
- Report Inappropriate Content
Hi There
I've run the tests and they complete without error. I have attached the logs.
The system is running on Intel high end server under Windows 64pro. RealTime is moot. It's not our server or our application - we merely provide a plugin that runs in a 30-40msec loop.
I am specifically trying to find what is causing our code to 'block' or stall for atypical periods over extended runs. The application runs normally in a 24/7 environment so I know it is not the code that causes a system reset when running under Amplifier.
I have now found that if I run outside of VS2010 using the Amplifier gui with a sample time of 20msec I can run Basic Hotspots. The performance of the application is, however, degraded - which means I'm not sure I can trust the results. As I said before. I want to run Amplifier to capture these spikes and try to determine what causes them.
I'm open to any practical suggestions as to what I can do to achieve this. But TBH, I'm getting slightly frustrated having to reset the machine every time I try something.
I can forward the output from Amplifier to you if this would help.
One final point, when Amplifier starts it prints a message:
"PulseEvent API used in the target application may prevent data collection. See the Troubleshooting help topic for more details"
I searched the guide but could find no mention of this.
Cheers
Steve
- Mark as New
- Bookmark
- Subscribe
- Mute
- Subscribe to RSS Feed
- Permalink
- Report Inappropriate Content
OK. Advanced-hotspots can work with duration 5 or duration 30, based on your result.
So, your target process is teamviewer_desktop.exe? It consumed ~13.6s of 30s. Where is your target dll module name?
You need to do "amplxe-cl -finalize -search-dir=dll-path -r r000ah"; dll-path (or sub-directory) should include .pdb files of your interest of exe/dll. That will help to filer into your selecting target dll, if it exists in report (you ran it during data collection).
- Mark as New
- Bookmark
- Subscribe
- Mute
- Subscribe to RSS Feed
- Permalink
- Report Inappropriate Content
Hi Peter
Err...No, Teamviewer is not the target process. The tests I ran did not load the target asfaik. It so happened that I was logged onto the server via teamviewer when I ran the commands you told me to run.
The point is that whenever I try to run the target process on anything other than basic hotspots it causes the machine to restart. I am not sure that anything gets logged when this occurs. I'll check and upload the logs if there are any
Steve
- Mark as New
- Bookmark
- Subscribe
- Mute
- Subscribe to RSS Feed
- Permalink
- Report Inappropriate Content
@Steve
What I got confused was that you attached advanced-hotspots results - posted at 11/21/2015 - 15:40. My understanding was that you can run event-based sampling with target process, actually Teamviewer is not the target process. You failed to run advanced-hotspot with target process (caused to reset the system), but hotspots analysis with target process can work. Am I right?
1. If the workaround is to use basic hotspots (user mode), the sample interval is 10ms as default, you may change it to 1, use option "-knob sampling-interval=1", if you target thread runs 40ms, we can capture 40 samples.
2. If you want to get back to advanced-hotspots (the benefit is sample-interval can be 0.01ms as minimal value, to capture more samples in target thread, you said running 40ms). Please set environments I posted at 11/17/2015 - 18:20, then run advanced-hotspots, VTune Amplifier will save trace logs before the system reset. That will be helpful to investigate - I don't know if the problem was caused by your runtime OS (timeout issue?), or caused by your target process. Thank you.
3. If you successfully collected data, please tell me your target process/thread - it should have no problem to see bottom-up report, to filter in selected process/thread. Please attached your basic hotspots result.
- Mark as New
- Bookmark
- Subscribe
- Mute
- Subscribe to RSS Feed
- Permalink
- Report Inappropriate Content
Hello,
Probably you can try to remove -knob collection-detail=stack-sampling from the command line you provided. This will trigger another collector and probably it will not fail though you will not have stacks.
Thanks & Regards, Dmitry
- Mark as New
- Bookmark
- Subscribe
- Mute
- Subscribe to RSS Feed
- Permalink
- Report Inappropriate Content
Hi Peter,
I'm sorry, but I don't quite understand what you are saying here. You sent me a command to run to collect logs - and I ran it. You need to be a bit more specific in what tests and logs I need to try. Your reply seems to imply that I should have run the target process after (or before?) I ran the tests you indicated. I did neither. I just ran the test.
Perhaps I could summarise my situation to clarify what I am trying to do and what I see.
1) I am running through the gui (vTune Amplifier XE) - not the command line. (Although if you think this will make a difference I will try)
2) My purpose here is to identify performance 'spikes'. Situations where our thread stalls for an extended period (60-100's msecs). These occur 6-10 times over a 12 hour period.
3) The target process introduces ~4000 threads - which makes analysis very hard.
4) I can run basic hotspot analysis - but 95% of the time nothing else works (advanced,concurrency,locks/waits). These hard reset the machine.
5) On the rare occasion that they do run the resulting analysis results do not give any info for the DLL - it shows it as an 'Unknown' module. Despite the fact that the project settings are the same. Why is this??!
6) If I run the DLL outside of the target host (in a test harness) it works. But this does not exhibit the problem
I have attached a (corrupt) log from an analysis that crashed the machine.
- Mark as New
- Bookmark
- Subscribe
- Mute
- Subscribe to RSS Feed
- Permalink
- Report Inappropriate Content
> My purpose here is to identify performance 'spikes'. Situations where our thread stalls for an extended period (60-100's msecs). These occur 6-10 times over a 12 hour period.
That is the problem, if you don't know when your dll works - probably Pause/Resume API will help to reduce result size.
>The target process introduces ~4000 threads - which makes analysis very hard.
Use "amplxe-cl -R hotspots -group-by thread -r r000hs" to display, if your thread is on Top N.
>I can run basic hotspot analysis - but 95% of the time nothing else works (advanced,concurrency,locks/waits). These hard reset the machine.
I wonder if basic hotspots can work, but you have no associated performance data of dll?
5) On the rare occasion that they do run the resulting analysis results do not give any info for the DLL - it shows it as an 'Unknown' module. Despite the fact that the project settings are the same. Why is this??!
6) If I run the DLL outside of the target host (in a test harness) it works. But this does not exhibit the problem
If you ran the DLL on other machine, which has a matched PDB files (or can search it), it displays hot function. If you run DLL on the host, have to copy associated PDB, if PDB is not in the path of DLL, you need to add option "-search-dir=path1".
For diagnosing the crash issue when running advanced-hotspots, please do in cmd:
1. Make new dir - for example, "c:\tmp\trace_log"
2. Set AMPLXE_LOG_LEVEL=TRACE
3. Set AMPLXE_LOG_DIR=c:\tmp\trace_log
4. Run amplxe-cl, or amplxe-gui in this cmd.
After running VTune analysis, result will be generated in c:\tmp\trace_log
- Mark as New
- Bookmark
- Subscribe
- Mute
- Subscribe to RSS Feed
- Permalink
- Report Inappropriate Content
Hi Peter
Thanks again for getting back
You say
>I wonder if basic hotspots can work, but you have no associated performance data of dll?
Basic hotspots does work and I do get back perf data for the DLL - It is the advanced/Concurrency and Locks/waits that cause reset (It's actually a bugcheck that occurs). I will attempt to get some extended crash info using the LOG_LEVEL you suggest.
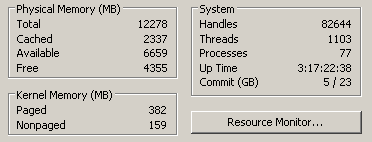
However, I have hit an issue with Basic hotspot now. If I try to run form more than an hour or so I get failures in collection:
"Failed to get a thread handle when attaching to the process due to OS error (Insufficient system resources exist to complete the requested service. ). Data for the thread will not be collected."
On the first run amplxe-runss.exe crashed. I have uploaded the last run we did along with faults.txt with the windows fault check, fault.png which is a snapshot of Amplifier and OS.png which is a snapshot of Windows Task manager resources in use. I have not uploaded the results folder since this is 480M.
Any ideas?
Cheers
Steve
- Mark as New
- Bookmark
- Subscribe
- Mute
- Subscribe to RSS Feed
- Permalink
- Report Inappropriate Content
Thanks for your further status update.
>Basic hotspots does work and I do get back perf data for the DLL - It is the advanced/Concurrency and Locks/waits that cause reset (It's actually a bugcheck that occurs). I will attempt to get some extended crash info using the LOG_LEVEL you suggest.
Peter: OK. In general, basic hotspots works but system reset was caused by advanced-hotspot/Concurrency/L&W analysis. I would like to see your trace log, then escalate data to developer.
> However, I have hit an issue with Basic hotspot now. If I try to run form more than an hour or so I get failures in collection:
"Failed to get a thread handle when attaching to the process due to OS error (Insufficient system resources exist to complete the requested service. ). Data for the thread will not be collected."
Peter: I guess this was insufficient resource issue, caused by VTune? You may try -
"amplxe-cl -collect-with runss -knob cpu-samples-mode=nostack -knob no-altstack=true -knob sampling-interval=20 - target-pid PID -duration n" ; no stack walk, no use alter stack, reduce samples; these may reduce extra resource use from VTune
If the problem persists on, I will report to developer.
Regards, Peter
P.S> You still need to run "amplxe-feedback -create-bug-report <report archive>", attach result for your system info.
- Subscribe to RSS Feed
- Mark Topic as New
- Mark Topic as Read
- Float this Topic for Current User
- Bookmark
- Subscribe
- Printer Friendly Page