- Mark as New
- Bookmark
- Subscribe
- Mute
- Subscribe to RSS Feed
- Permalink
- Report Inappropriate Content
Hi,
I have an application built with intel compilers (version 15) and -g -O2 mode (optim+debug info).
The application was run through amplxe-cl -collect hotspots.
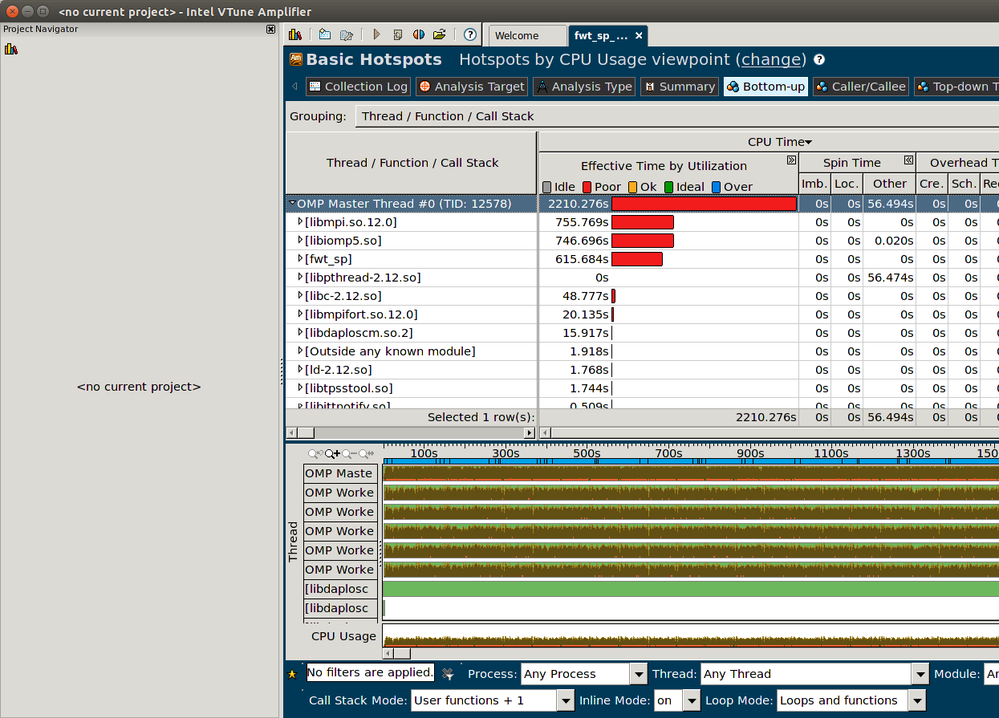
When lauchin VTune on the collected info, I would expect to find (as explained in a tutorial video) the time spent in the more time consuming function. Instead, I get:
Which is not really helpful.
Also, VTune seems a little bit confused with the concept of function vs library (see image below).
Is there an alternative to VTune do profile code compiled with Intel ? I just need the usual information, time spend in functions, loops, cache misses etc...
Regards
Link Copied
- Mark as New
- Bookmark
- Subscribe
- Mute
- Subscribe to RSS Feed
- Permalink
- Report Inappropriate Content
I think the reason of this confused view is inability to locate binary files which you submitted before. Due to that VTune wasn't able to get any function info from the binary since it wasn't able to locate it - it marked everything fallen to corresponding module as [module].
Are you launching or attaching to the application? Do you start collection right from VTune GUI?
- Mark as New
- Bookmark
- Subscribe
- Mute
- Subscribe to RSS Feed
- Permalink
- Report Inappropriate Content
Th collection was started from the command line through Intel's mpiexec.hydra (--collect hotspots).
I then started amplxe-gui and loaded a .amplxe file.
The problem is that I cannot edit the 'analysis target' view (I don't know why) where the binary_location seems to be specified.I copied the binary in the same directory as the .amplxe file, just in case, but it did not change anything.
Thanks
- Mark as New
- Bookmark
- Subscribe
- Mute
- Subscribe to RSS Feed
- Permalink
- Report Inappropriate Content
If you create "all" subdirectory in result dir and put all the binary files there, then run Re-resolve from GUI, the problem should gone.
When you start analysis, you may specify -no-auto-finalize option for amplxe-cl. Then finalize result specifying binary and symbol files location via:
> amplxe-cl -I -search-dir=<path> -r <result_dir_path>
- Mark as New
- Bookmark
- Subscribe
- Mute
- Subscribe to RSS Feed
- Permalink
- Report Inappropriate Content
Hello,
Could you please provide the fill command line?
Is fwt_sp a user bunary? Then it looks strange that with default -g option we don't see symbols for the module by deafult..
- Mark as New
- Bookmark
- Subscribe
- Mute
- Subscribe to RSS Feed
- Permalink
- Report Inappropriate Content
Hello dmitry, I think it might be related with Vitaly's comment. That is, the different search path are missing. I'm re-running finalize with those path specified, but it take time.
I'll tell you how it went.
Thanks
- Mark as New
- Bookmark
- Subscribe
- Mute
- Subscribe to RSS Feed
- Permalink
- Report Inappropriate Content
Hello,
I'm trying to understand why it does not work out-of-the box. Theoretically if result finalization is done on the same machine when collection wa run - we should not see the picture as you posted so it would be very helpful to see the exact command line you used (you can obfuscate the appication name if needed).
Thank you, Regards, Dmitry
- Mark as New
- Bookmark
- Subscribe
- Mute
- Subscribe to RSS Feed
- Permalink
- Report Inappropriate Content
The application was launched through:
mpiexec.hydra -f $OAR_FILE_NODES -bootstrap-exec oarsh -perhost $nb_cpu amplxe-cl -r fwt_sp_vtune -collect hotspots -- ./fwt_sp
which generated 4 directories:
[alainm@gurney inclusion_workvtune]$ ls fwt_sp_vtune.?
fwt_sp_vtune.0:
archive config data.0 fwt_sp fwt_sp_vtune.0.amplxe runtool.12566.ipc sqlite-db
fwt_sp_vtune.1:
archive config data.0 fwt_sp_vtune.1.amplxe runtool.12568.ipc
fwt_sp_vtune.2:
archive config data.0 fwt_sp_vtune.2.amplxe
fwt_sp_vtune.3:
archive config data.0 fwt_sp_vtune.3.amplxe
[alainm@gurney inclusion_workvtune]$
I'm tryin to analyze the number 0.
Also, I did run the finalize from the command line agn (specifying the path) and I still get the "could not locate file" error. Here is the log
note the all those flles (appart from [vsyscall] exists:
[alainm@gurney inclusion_workvtune]$ for i in $(grep Cannot ./fin.log | sed -e 's/.*`//' -e 's/..$//'); do ls $i; done
/usr/lib64/libdaploucm.so.2
ls: cannot access [vsyscall]: No such file or directory
/softs/intel/impi/5.0.1.035/intel64/lib/libmpifort.so.12.0
/lib64/libpthread-2.12.so
/usr/lib64/libibverbs.so.1
/softs/intel/composer_xe_2015.0.090/compiler/lib/intel64/libiomp5.so
/softs/intel/vtune_amplifier_xe_2015.1.1.380310/lib64/libtpsstool.so
/softs/intel/vtune_amplifier_xe_2015.1.1.380310/lib64/pinruntime/glibc/libc-2.3.4.so
/softs/intel/impi/5.0.1.035/intel64/lib/release/libmpi.so.12.0
/softs/intel/vtune_amplifier_xe_2015.1.1.380310/lib64/runtime/libittnotify.so
/usr/lib64/libdaploscm.so.2
/lib64/ld-2.12.so
/bin/grep
/bin/bash
/usr/bin/numactl
/lib64/libc-2.12.so
/usr/lib64/libmlx4-rdmav2.so
/bin/gawk
/usr/lib64/libdaplofa.so.2
[alainm@gurney inclusion_workvtune]$
Also, the fwt_sp file (which is the profiled aplication) has been copied from the parent directory.
A++
- Mark as New
- Bookmark
- Subscribe
- Mute
- Subscribe to RSS Feed
- Permalink
- Report Inappropriate Content
When running through mpi on different nodes from where the application was built, and possibly analyzing on yet another node, it's hardly surprising that search paths may need setting.
If, as is usually the case, a single node VTune collection is sufficient, that is a useful learning step as it doesn't involve analyzing separately data collection from various nodes.
- Mark as New
- Bookmark
- Subscribe
- Mute
- Subscribe to RSS Feed
- Permalink
- Report Inappropriate Content
From the information you provided we can see that fwt_sp_vtune.1,fwt_sp_vtune.2,fwt_sp_vtune.3 don't have sqlite-db directory and most likely the same was with fwt_sp_vtune.0 until you start manual result opening that created it with unresolved modules. This is unexpected. Could you please look at output spawned by VTune on compute node under mpiexec.hydra? Probably we can see there why the results were not finalized.
On search directories: please use multiple -search-dir options (per direcory) rather than one -search-dir with colon separating multiple directories. It should help if the paths are valid.
Thanks & Regards, Dmitry
- Mark as New
- Bookmark
- Subscribe
- Mute
- Subscribe to RSS Feed
- Permalink
- Report Inappropriate Content
here is the ampl-xe output collected under mpiexec.hydra:
could the following (to which I should have paid attention) explan the issue:
amplxe: Warning: The specified data limit of 500 MB is reached. Data collection is stopped.
amplxe: Collection detached.
amplxe: Warning: The specified data limit of 500 MB is reached. Data collection is stopped.
amplxe: Collection detached.
amplxe: Warning: The specified data limit of 500 MB is reached. Data collection is stopped.
amplxe: Warning: The specified data limit of 500 MB is reached. Data collection is stopped.
amplxe: Collection detached.
amplxe: Collection detached.
???
- Mark as New
- Bookmark
- Subscribe
- Mute
- Subscribe to RSS Feed
- Permalink
- Report Inappropriate Content
- Mark as New
- Bookmark
- Subscribe
- Mute
- Subscribe to RSS Feed
- Permalink
- Report Inappropriate Content
There should not be something wrong that data limit was reached.
But usually after collection is finished successfully VTune should report at the end with
amplxe: Collection stopped.
in output even it was detached with data limit. And after this finalization usually starts. We don't see 4 records "Collection stopped" in the output. Can be the case that the job on the cluster was ended by timeout? Did you see all expected output?
Regards, Dmitry
- Mark as New
- Bookmark
- Subscribe
- Mute
- Subscribe to RSS Feed
- Permalink
- Report Inappropriate Content
I can also notice that based on result directory structure (existing .ipc files) collection hasn't been finished yet to the moment result was opened in GUI. If you launch application via amplxe-cl, you need to wait until application finishes before opening results even if data limit was reached. I suspect you have fwt_sp and amplxe-cl processes running when you open results.
- Mark as New
- Bookmark
- Subscribe
- Mute
- Subscribe to RSS Feed
- Permalink
- Report Inappropriate Content
There is a possibility that the collection was interrupted by the job scheduler. I just relaunched with a longer time limit. The previous limit was based on the job runtime alone plus a security. I just added an hour.
I'll post the conclusions.
Thanks
- Mark as New
- Bookmark
- Subscribe
- Mute
- Subscribe to RSS Feed
- Permalink
- Report Inappropriate Content
FWIT, it was restarted with:
mpiexec.hydra -f $OAR_FILE_NODES -bootstrap-exec oarsh -perhost 2 amplxe-cl -r fwt_sp_vtune -no-auto-finalize -target-duration-type=long -collect hotspots -- ./fwt_sp
Note that I already have the:
amplxe: Warning: The specified data limit of 500 MB is reached. Data collection is stopped.
message despite the -target-duration-type=long, I do not know if this is to be expected.
Alain
- Mark as New
- Bookmark
- Subscribe
- Mute
- Subscribe to RSS Feed
- Permalink
- Report Inappropriate Content
This warning appears when amount of data collected reaches 500Mb (default value). You can override it via corresponding command line option though if you collect too much data, GUI might become sluggish.
Also, if you launch amplxe-cl via mpiexec I would recommend to remove "-no-auto-finalize" option to avoid binary location problem you have in another post. Without it results will be finalized on the nodes where collection occurred.
- Mark as New
- Bookmark
- Subscribe
- Mute
- Subscribe to RSS Feed
- Permalink
- Report Inappropriate Content
So, I ran with no limit on data size and thus got no warnings related with size limits.
I ran the 'finalize' off line, on a different machine, but with the same filesystem.
The result is the same.
I just connected on the run node in order to run the finalize again in precisely the same environment.
Note that it still complain about not finding files that are there
mplxe: Warning: Cannot locate file `/lib64/libc-2.12.so'.
amplxe: Warning: Cannot locate file `/softs/intel/impi/5.0.1.035/intel64/lib/libmpifort.so.12.0'.
amplxe: Warning: Cannot locate file `/softs/intel/vtune_amplifier_xe_2015.1.1.380310/lib64/pinruntime/glibc/libc-2.3.4.so'.
amplxe: Warning: Cannot locate file `/softs/intel/vtune_amplifier_xe_2015.1.1.380310/lib64/libtpsstool.so'.
amplxe: Executing actions 33 % Resolving information for `libmpi.so.12.0'
amplxe: Warning: Cannot locate file `/lib64/libpthread-2.12.so'.
in particular: /softs is mounted on both machines.
Alain
- Mark as New
- Bookmark
- Subscribe
- Mute
- Subscribe to RSS Feed
- Permalink
- Report Inappropriate Content
Also, if I let the limit on the collected data size I get the " amplxe: Collection detached. " message.
Alain
- Mark as New
- Bookmark
- Subscribe
- Mute
- Subscribe to RSS Feed
- Permalink
- Report Inappropriate Content
So using exactly the same machine for finalize, I got
amplxe: Using result path `/gpfs/scratch/alainm/view/seiscope/codes/3D_Acoustic/FWT3D_DSFDM/trunk/relsym/demo/inclusion_workvtune1/fwt_sp_vtune.0'
amplxe: Executing actions 0 %
amplxe: Warning: The result contains a lot of raw data. Finalization may take a long time to complete.
amplxe: Executing actions 23 % Loading '10935-10955.0.trace' file
amplxe: Executing actions 33 % Resolving module symbols
amplxe: Warning: Cannot locate file `[vsyscall]'.
amplxe: Executing actions 35 % Resolving information for `libpthread-2.12.so'
amplxe: Warning: Cannot locate debugging symbols for file `/lib64/libpthread-2.12.so'.
amplxe: Executing actions 36 % Resolving information for `libc-2.12.so'
amplxe: Warning: Cannot locate debugging symbols for file `/lib64/libc-2.12.so'.
amplxe: Executing actions 37 % Resolving information for `libdl-2.12.so'
amplxe: Warning: Cannot locate debugging symbols for file `/lib64/libdl-2.12.so'.
amplxe: Executing actions 37 % Resolving information for `libtpsstool.so'
amplxe: Warning: Cannot locate debugging symbols for file `/softs/intel/vtune_amplifier_xe_2015.1.1.380310/lib64/libtpsstool.so'.
amplxe: Executing actions 38 % Resolving information for `ld-2.12.so'
amplxe: Warning: Cannot locate debugging symbols for file `/lib64/ld-2.12.so'.
amplxe: Executing actions 38 % Resolving information for `libc-2.3.4.so'
amplxe: Warning: Cannot locate debugging symbols for file `/softs/intel/vtune_amplifier_xe_2015.1.1.380310/lib64/pinruntime/glibc/libc-2.3.4.so'.
amplxe: Executing actions 40 % Resolving information for `libittnotify.so'
amplxe: Warning: Cannot locate debugging symbols for file `/softs/intel/vtune_amplifier_xe_2015.1.1.380310/lib64/runtime/libittnotify.so'.
amplxe: Executing actions 100 % done
[alainm@r428 inclusion_workvtune1]$
Which is better, but weirds. Some of these files (the ones in /softs) are on the same filesystem.
ALain
- Mark as New
- Bookmark
- Subscribe
- Mute
- Subscribe to RSS Feed
- Permalink
- Report Inappropriate Content
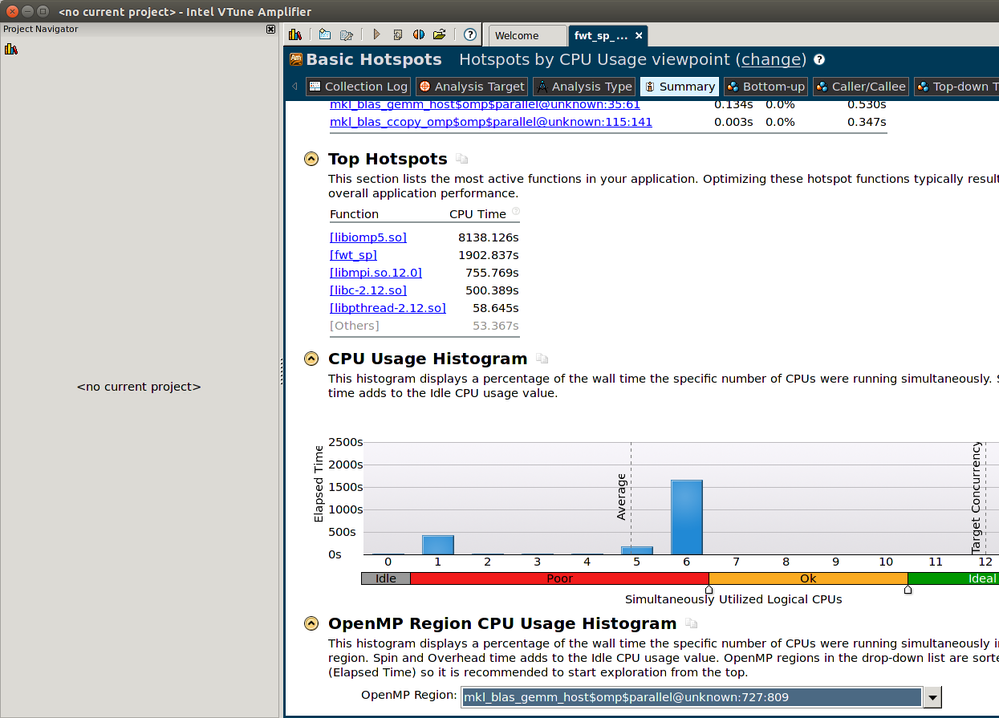
And launching the gui from the same machine raises more ralstic measures.
- Subscribe to RSS Feed
- Mark Topic as New
- Mark Topic as Read
- Float this Topic for Current User
- Bookmark
- Subscribe
- Printer Friendly Page

