- Marcar como nuevo
- Favorito
- Suscribir
- Silenciar
- Suscribirse a un feed RSS
- Resaltar
- Imprimir
- Informe de contenido inapropiado
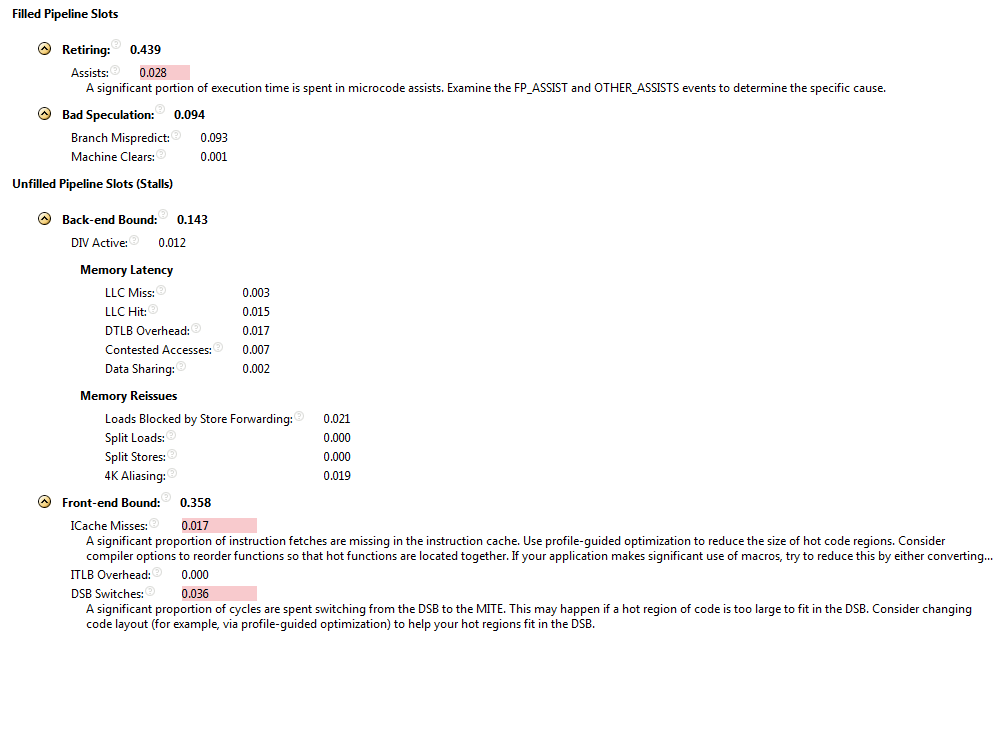
I have implemented some code using two approaches. I am looking at the results (attached) and I can tell that the "faster" version had less branch mispredictions, less L1 instruction cache misses, less TLB misses but I cannot calculate how many CPU cycles were consumed. The total difference between the two designs is several billion instructions.
Could somebody please glance at my results and assist me in how I can determine where the "additional" CPU cycles were consumed?
These are the memory access costs I have found:
- L1 cache miss 4 cycles
- L2 cache miss 10 cycles
- L3 cache miss 40 - 75 cycles
- Hitting main memory 350 cycles
- TLB miss 7 - 16 cycles
- ucode cache miss ??? cycles
The results are quite hard to interpret because they have this magic "rate" measurement- rather than actual number of CPU cycles spent for each of the metrics. I am using an Ivy Bridge CPU so I cannot see many of the event counters.
Ideally I would just be able to see the raw event counters but it seems these have been abstracted away from the GUI...... :s
(I cannot see the raw event counters even in source code view- because it looks like these have been hidden for Ivy Bridge)
Enlace copiado
- Suscribirse a un feed RSS
- Marcar tema como nuevo
- Marcar tema como leído
- Flotar este Tema para el usuario actual
- Favorito
- Suscribir
- Página de impresión sencilla