- Mark as New
- Bookmark
- Subscribe
- Mute
- Subscribe to RSS Feed
- Permalink
- Report Inappropriate Content
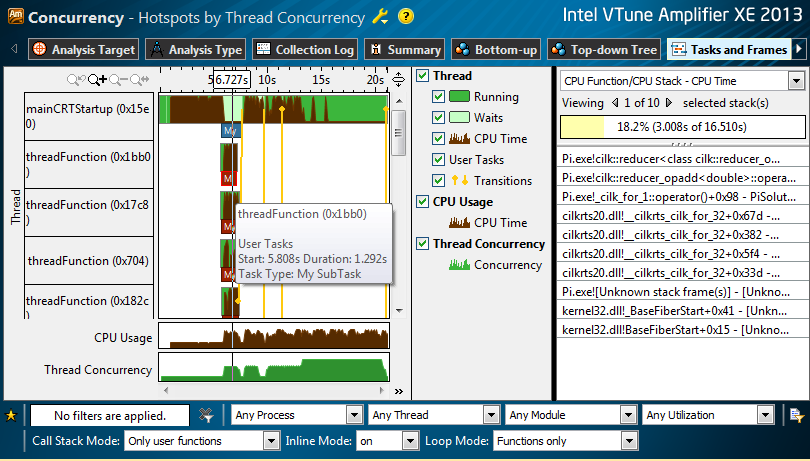
I recently started using the __itt_task_begin / end APIs to mark code segments. In the Tasks and Frames section of a capture the tasks show up in what looks like correct nesting, but they are all red and don't have the names. I've double checked and it looks like valid string handles are going into the task_begin functions. Any idea what's going on here? Thanks.
Link Copied
- Mark as New
- Bookmark
- Subscribe
- Mute
- Subscribe to RSS Feed
- Permalink
- Report Inappropriate Content
- Mark as New
- Bookmark
- Subscribe
- Mute
- Subscribe to RSS Feed
- Permalink
- Report Inappropriate Content
- Mark as New
- Bookmark
- Subscribe
- Mute
- Subscribe to RSS Feed
- Permalink
- Report Inappropriate Content
Marcus W. wrote:
1. I did select Analyze user tasks.
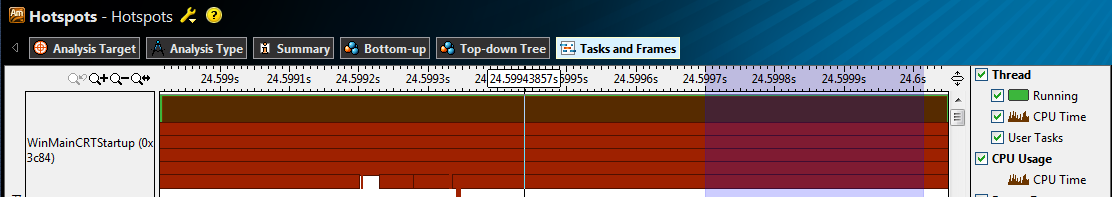
2. In the 'Tasks and Frames' tab, The blocks under the brown CPUTime bars are all red and display nothing when moused over.
3. Yes this is on VTune(TM) Amplifier XE 2013 XE Update 3 (build 261256)
I don't know what happened on your side, I just wrote a simplest example (for Windows) of using Task APIs.
Please refer to this KB http://software.intel.com/en-us/articles/a-simplest-example-to-use-task-apis-in-your-code
- Mark as New
- Bookmark
- Subscribe
- Mute
- Subscribe to RSS Feed
- Permalink
- Report Inappropriate Content
It seems like if I create my stringhandles every frame it's fine, but if I change my profile macros around so that I have a static pointer to the string handle it all goes wrong. e.g.
# define PROFILE_BEGIN(name) { \
static void * gs_pVTuneTask = VTune::CreateStringHandle(name); \
Profiler::Push(ZProfiler::EChannel_Default, name, gs_pVTuneTask); \
}
Where the scoped gs_pVTuneTask gets down to the __itt_task_begin and cast back. Most of our profiled code is wrapped in
PROFILE_BEGIN("SomeTaskName")
PROFILE_END
Am I just doing something obviously bad here? Creating the string handles every frame in the MACRO is horribly slow....
- Mark as New
- Bookmark
- Subscribe
- Mute
- Subscribe to RSS Feed
- Permalink
- Report Inappropriate Content
No need to create the string handles in every frame, you can do __itt_string_handle_create() in Initializing stage, and use __itt_task_begin() and __itt_task_end() later.
- Mark as New
- Bookmark
- Subscribe
- Mute
- Subscribe to RSS Feed
- Permalink
- Report Inappropriate Content
Yes that's what I would have thought, but when I switch to using the macro I posted and to wrap it around my code to profile, I get red unnamed tasks in the results. I even wrapped a mutex lock around the create in case the itt_string_handle_create wasn't thread safe, but that didn't seem to help. Though these creates don't happen in a 'stage' they happen the first time the profile_begin gets hit for a given section of code. Is there perhaps some bad interaction if you create more stringhandles while already inside a task?
- Mark as New
- Bookmark
- Subscribe
- Mute
- Subscribe to RSS Feed
- Permalink
- Report Inappropriate Content
I thought there might be a problem with the static initialization of the stringhandle holding variable in my MACRO because we are using this macro in some functors, of which multiple copies get kicked off at once. So i've now made my VTune::CreateStringHandle utility function do a mutex locked hash table lookup based on the crc of the string passed in to see if I've already generated a valid string handle, and only if I haven't to generate one and add it to the hash. The whole process should be threadsafe now.
I've placed asserts around my inputs to _itt_task_begin() and it is ALWAYS passing a good string handle (as far as I know how to tell).
And my tasks are STILL not displaying properly. I STILL cannot get the tasks to display properly unless I create the string handles every frame in that macro. This is in fact terribly slow because VTUNE itself shows me that shitloads of time is burned in StringCompares, presumably because you're walking the entire linked list of stringhandles and doing a string compare to decide if you need to add a new one. However, I can't see how that's really any different at all than my hashing scheme which is basically the same, just a little faster.
I really want to get this resolved because I want tasks on my captures, and I don't want strignhandlecreate to dominate my profiles.
I really cannot pre-init all my string handles because the entire code base is littered with these profiling macros (It's a game, so we time a lot of things every frame). I'd have to scrape all the code in a pre-process to collect them all or something, and then I'd still have to look them up from some hash every time to pass them to _itt_task_begin.
In short, I don't know where to go from here since I'm verifying I'm passing good data to _itt_task_begin. Would it help if I sent you guys a capture?
- Mark as New
- Bookmark
- Subscribe
- Mute
- Subscribe to RSS Feed
- Permalink
- Report Inappropriate Content
I don't know if the tool supports this usage mode (wrape the APIs in MACRO and create string handle frame by frame - poor performance). Will talk with the developer and update soon.
- Mark as New
- Bookmark
- Subscribe
- Mute
- Subscribe to RSS Feed
- Permalink
- Report Inappropriate Content
Cool thanks. Though to clarify, creating the string handle frame to frame is the ONLY thing I've done that works (albeit slowly). Creating them and then looking them up from a hash table is what is NOT working.
- Mark as New
- Bookmark
- Subscribe
- Mute
- Subscribe to RSS Feed
- Permalink
- Report Inappropriate Content
I need your cooperation to help further investigating:
1. Result directories with unnamed tasks after using both hotspots and lightweight hotstpos on the same workload
2. If possible to give us pieces of source code (MACRO definitions, use MACRO) of using __itt_task APIs
Thanks, Peter
- Mark as New
- Bookmark
- Subscribe
- Mute
- Subscribe to RSS Feed
- Permalink
- Report Inappropriate Content
Alright, I'll upload those today sometime.
- Mark as New
- Bookmark
- Subscribe
- Mute
- Subscribe to RSS Feed
- Permalink
- Report Inappropriate Content
- Mark as New
- Bookmark
- Subscribe
- Mute
- Subscribe to RSS Feed
- Permalink
- Report Inappropriate Content
Marcus W. wrote:
Ok, sorry this took so long, I had a lot of other work that needed to get done. Anyway, here's the captures, and some files that lay out the macro I use and the usage. I put a list of the various macros and methods I tried at the top of the .h file.
zip file is corrupted so I cannot extract. Would you please verify after downloading, and put a right zip file? Thank you.
- Mark as New
- Bookmark
- Subscribe
- Mute
- Subscribe to RSS Feed
- Permalink
- Report Inappropriate Content
- Mark as New
- Bookmark
- Subscribe
- Mute
- Subscribe to RSS Feed
- Permalink
- Report Inappropriate Content
Bump. Any news on this? Thanks.
- Mark as New
- Bookmark
- Subscribe
- Mute
- Subscribe to RSS Feed
- Permalink
- Report Inappropriate Content
Marcus W. wrote:
Bump. Any news on this? Thanks.
I have received your data and the problem is under investigating. I will get back as soon I can (by end of next week), thanks for your patiences.
Thanks, Peter
- Mark as New
- Bookmark
- Subscribe
- Mute
- Subscribe to RSS Feed
- Permalink
- Report Inappropriate Content
Cool, thanks Peter.
- Mark as New
- Bookmark
- Subscribe
- Mute
- Subscribe to RSS Feed
- Permalink
- Report Inappropriate Content
It seemed a bug in VTune(TM) Ampifier XE, the fix will be ready at next release.
- Mark as New
- Bookmark
- Subscribe
- Mute
- Subscribe to RSS Feed
- Permalink
- Report Inappropriate Content
Awesome!
- Subscribe to RSS Feed
- Mark Topic as New
- Mark Topic as Read
- Float this Topic for Current User
- Bookmark
- Subscribe
- Printer Friendly Page