- Mark as New
- Bookmark
- Subscribe
- Mute
- Subscribe to RSS Feed
- Permalink
- Report Inappropriate Content
I am developing a dll. I have no control over the software that calls this dll. I have performance issues, and I'm sure that VTUNE could be invaluable here. My question is this: Can I use VTUNE in this set of circumstances, and if so, how?
Link Copied
- Mark as New
- Bookmark
- Subscribe
- Mute
- Subscribe to RSS Feed
- Permalink
- Report Inappropriate Content
Hi Chris,
There are several alternatives:
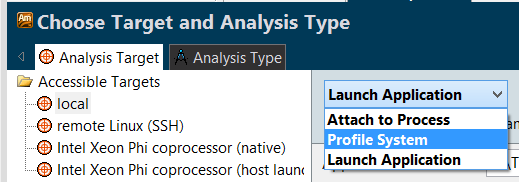
1. "Attach to Process" mode. It will work if you can run VTune Amplifier with credentials suffiucient to get acces to the running process of the software which calls your dll. See more details in the product help: https://software.intel.com/en-us/node/596522
2. Profile-System mode - available for Advanced Hotspots and other Microarhitecture analysis. But in this mode - there will be no stacks collected. When it displays the results, you will be able to filter the data based on the processes of modules of interest. See more: https://software.intel.com/en-us/node/596523
3. And for more fine-grained tuning, you can try instrumenting your DLL code with ITT User API which can control collection start/pause/stop and gather additional statistic from your code depending on API you use. Then you will be able to use either Attach to Process or Profile System options, and control collection start/stop right from your dll code.
More details here: https://software.intel.com/en-us/node/596660 ; and here: https://software.intel.com/en-us/node/596654
In either option you will need to make sure the dll has debug symbols available and specified in the search path in the VTune project properties. So VTune will be able to resolve symbol info and attribute collected samples to your source code.
Regards, Katya
- Subscribe to RSS Feed
- Mark Topic as New
- Mark Topic as Read
- Float this Topic for Current User
- Bookmark
- Subscribe
- Printer Friendly Page
