- 新着としてマーク
- ブックマーク
- 購読
- ミュート
- RSS フィードを購読する
- ハイライト
- 印刷
- 不適切なコンテンツを報告
Hi, guys.
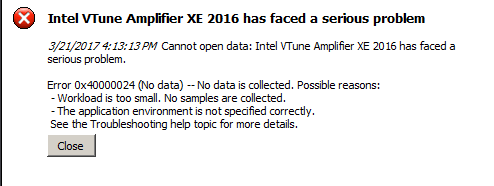
I'm trying to run Locksa and Waits analysys but I've got an 0x40000024 error for my project and Intel demo project both. I tried to find something about this issue using this forum but haven't made it yet due to lack of the information about this mode.
Let me specify my configuration:
C++ code, Visual studio 13, VTune XE 2016 update 4 (470476). I've installed the software with an installer, run the proper .bat file in the Intel VTune folder and set up debugging settings in the release mode.
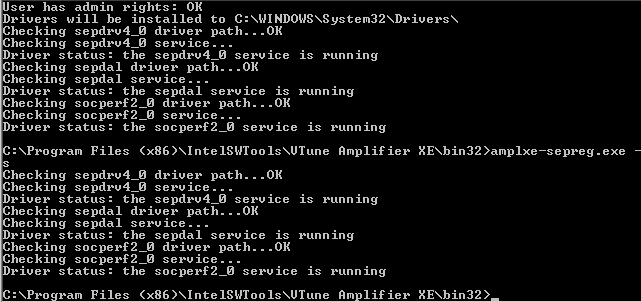
I'm trying to run Locks and Waits analysis in paused mode (but I tried to simply run it as well) as result Vtune doesn't run my application but starts the Finalize stage immediately and generates the 0x40000024 error as a result.
Unfortunately I'm working with huge legacy code and my aim is to parallelize it with the OpenMP. I found that some locks obviously exist and I need the tool to speed up their localization. Please advise.
Best regards, Maxim
コピーされたリンク
- 新着としてマーク
- ブックマーク
- 購読
- ミュート
- RSS フィードを購読する
- ハイライト
- 印刷
- 不適切なコンテンツを報告
I'l move this thread to the VTune support forum.
- 新着としてマーク
- ブックマーク
- 購読
- ミュート
- RSS フィードを購読する
- ハイライト
- 印刷
- 不適切なコンテンツを報告
Hello Maxim,
Could we get more details to clarify the situation:
Do you run the analysis under Visual Studio or from VTune standalone GUI?
How do you specify the path to OpenMP runtime library? Why I'm asking is that the problem looks like the application does not start properly being run under VTune.
Thanks & Regards, Dmitry
- 新着としてマーク
- ブックマーク
- 購読
- ミュート
- RSS フィードを購読する
- ハイライト
- 印刷
- 不適切なコンテンツを報告
Hello, Dmitry. Thank you for the responce!
I run the VTube from Visual studio mainly. But I tried to do it through standalone as well with the same result.
I haven't found any directions about the OpenMP path so could you clarify where and how I can check it? I hope it can be a point of my headache. Maxim.
- 新着としてマーク
- ブックマーク
- 購読
- ミュート
- RSS フィードを購読する
- ハイライト
- 印刷
- 不適切なコンテンツを報告
Hello Maxim,
Let's do the following experiment:
In console window change dir where your application is placed to.
Run the application and be sure that it worked fine. If no and it is complaining that it cannot find openmp dll add something like this
>set PATH=%PATH%;<path_to_libiomp5md.dll>
Run the following command right here:
<VTune_install_path>/bin64/amplxe-cl -collect locksandwaits <you_application>
and see if it works.
Thanks & Regards, Dmitry
- 新着としてマーク
- ブックマーク
- 購読
- ミュート
- RSS フィードを購読する
- ハイライト
- 印刷
- 不適切なコンテンツを報告
Hi Dmitry.
If I understand you correct my application is run manualle from console. But vtune (that is run from console) doesn't run the application as in previous attempts. I haven't seen any messages about the openMP problems.Perhaps I don't understand what I should do
- 新着としてマーク
- ブックマーク
- 購読
- ミュート
- RSS フィードを購読する
- ハイライト
- 印刷
- 不適切なコンテンツを報告
At the same time if i run the VTune from VD in adwanced hotspots mode it is able to run my application and collect some data,
- 新着としてマーク
- ブックマーク
- 購読
- ミュート
- RSS フィードを購読する
- ハイライト
- 印刷
- 不適切なコンテンツを報告
Could you please try advanced-hotspots analysis type?
Thanks & Regards, Dmitry
- 新着としてマーク
- ブックマーク
- 購読
- ミュート
- RSS フィードを購読する
- ハイライト
- 印刷
- 不適切なコンテンツを報告
Yes, Dmitry, it works, but I can't find nothing about my dedlock in the results. I thought that locks and waits analysis would help me.
- 新着としてマーク
- ブックマーク
- 購読
- ミュート
- RSS フィードを購読する
- ハイライト
- 印刷
- 不適切なコンテンツを報告
While we are figuring out possible reasons I can recommend the following:
Use a knob to switch on OpenMP analysis based on tracing from Intel OpenMP. In CL it can be done adding "-knob analyze-openmp=true", in GUI there is a check-box on analysis type pane "Analyze OpenMP regions".
After you run the profile you will have additional info about parallel regions in summary pane and see wall-time based potential gain metric per lexical region that is based on different kind of losses including spins on locks during contention.
Press link on a region of interest and look in grid view the wall-time cost of locks for a region or a parallel loop. If you use several locks in one loop - you will not be able to distinct a cost of particular lock and here you will need locks and waits.
Thanks & Regards, Dmitry
- 新着としてマーク
- ブックマーク
- 購読
- ミュート
- RSS フィードを購読する
- ハイライト
- 印刷
- 不適切なコンテンツを報告
Yes, Dmitry. I've already tried advanced hotspots with openMP checkbpx is switched on. The problem that I've got unpredictable number of locks and one (or some) of them is dead one, And the main task is to catch these deadlocks in the huge amount of the legacy code. Now i'm trying to understand what I should do with. Do you thing the advanced hotspot analysis is able to help me?
- 新着としてマーク
- ブックマーク
- 購読
- ミュート
- RSS フィードを購読する
- ハイライト
- 印刷
- 不適切なコンテンツを報告
Hello Maxim,
If you want to figure out deadlock we have a special tool for this - Intel Inspector (a part of parallel studio). It support OpenMP locks and will show you even potential deadlocks I suppose. Please try this out. Meanwhile we will contact you on the problem with VTune Locks and Waits to figure out why the app cannot work correctly under analysis.
Thanks & Regards, Dmitry
- 新着としてマーク
- ブックマーク
- 購読
- ミュート
- RSS フィードを購読する
- ハイライト
- 印刷
- 不適切なコンテンツを報告
Thank you for the hint, Dmitry.
Unfortunately at the moment we haven't got a license for inspector, only for compiler, TBB and some libs (and VTune separately), but I believe I can try to use trial.
Defenitely if I can help you with some additional data for the topic problem please contact me.

