- Mark as New
- Bookmark
- Subscribe
- Mute
- Subscribe to RSS Feed
- Permalink
- Report Inappropriate Content
I'm sorry I could not find any place to file an official enhancement request, so I'm posting this to the forum. If there is another place more appropriate to file this, please let me know and I'll refile it there.
Title: VTune Enhancement Request: Make Source/Asm Browser Standalone
Why I want this:
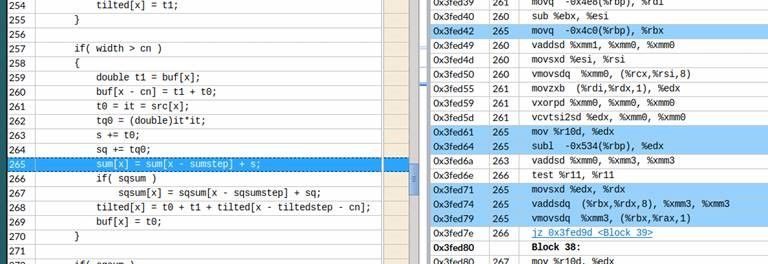
As I optimize the code I'm working on, I do a lot of analysis of the assembly generated by the C++ compiler when using highly optimized settings like -O3. With these settings the code has a tendency to spread making it difficult to know what asm lines belong to what source lines. The source browser in vtune is the only decent gui I've seen that makes identifying the code for a particular line dead simple to see. Below is the kind of view I'm talking about - Notice how easy it is to see what happened to that particular line of code when the optimizing compiler was done with it.
(Image also post below - had trouble inlining the image properly - so it may not have worked)
Why existing solutions are not good enough:
I've tried using many other tools, but nothing comes close to what this browser can do. Tools like objdump and addr2line have the information, but are confusing and very difficult to look through. It is difficult to really see the big picture like the image above shows. And things like Godbolt can compile code and show you the asm, but don't really work with larger codebases and still won't help you with the association of line of source to line of asm like above.
So far, the source code viewer in vtune is the only tool I've seen that has the ability to quickly show the connection between a line of source and the asm that it becomes. It really is a fantastic tool for quickly viewing and understanding the assembly that is generated.
The Problem with vtune right now:
Unfortunately pulling up the vtune source browser has some limitations that are very bothersome:
- You need to create a project and run a profiling run before you can view any code at all
- When you do a profile, you can only call up the code for the functions and files that appear in the results tables for the run type you did.
- There's no way to simply open a particular file or function that you want to see - you have to find the function in the gui list wherever it might be.
What I'm asking for:
I'd want to have some way to call up the source browser on arbitrary source files in my code base. Right now I can only see the files for which the vtune gui lists a function that has been profiled and only after I've actually run some kind of profiled run. Even then, I can only really open the browser for functions that are listed in the gui. I want the ability to tell the browser to open up file xxx.cpp using compiled file xxx.o or libyyy.so, and I want to be able to do this even if I have not run any profiling runs.
How it might work:
I could see this working in a few different ways:
- A standalone linux command line tool bundled with VTune (maybe called amplxe-srcview) where you can specify the file and/or the binary and it pulls up a new linux window with the clickable src/asm view in it. If there is a way to auto-detect the source file, this would be a bonus.
- A clickable button in the amplxe-gui window that could pull up a list of all the files associated with the currently loaded binary on the current project. Then I select the file I want to see and it opens the browser in another window or tab. I want to be able to do this even if I have not run any code yet. It already knows my binary and my source path, so I should not have to run.
- A separate tool completely divorced from Vtune that can be downloaded and used separately.
Link Copied
- Mark as New
- Bookmark
- Subscribe
- Mute
- Subscribe to RSS Feed
- Permalink
- Report Inappropriate Content
- Subscribe to RSS Feed
- Mark Topic as New
- Mark Topic as Read
- Float this Topic for Current User
- Bookmark
- Subscribe
- Printer Friendly Page
