- Mark as New
- Bookmark
- Subscribe
- Mute
- Subscribe to RSS Feed
- Permalink
- Report Inappropriate Content
Hi,
I profiled my C++ application program which does parallelize using openmp.
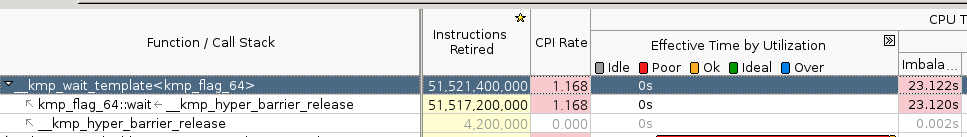
As I wrote in the title, Vtune shows very high number of instructions retired on '__kmp_wait_template<kmp_flag_64>'.
(It's top-ranked one...)
So I think the CPU resources are wasted in my code
What does the function '__kmp_wait_template<kmp_flag_64>' exactly do?
Does it mean that there are huge workload skew between the threads?

Link Copied
- Mark as New
- Bookmark
- Subscribe
- Mute
- Subscribe to RSS Feed
- Permalink
- Report Inappropriate Content
You may have noticed that a bug resembling this was present in libiomp5 prior to the 16.0.1 compiler release. So, it would help if you would state your version or supply more information.
- Mark as New
- Bookmark
- Subscribe
- Mute
- Subscribe to RSS Feed
- Permalink
- Report Inappropriate Content
Hello,
This is the time that was spent in runtime in spinning on barrier (imbalance) or waiting for parallel work by worker threads.
You can find this classification in the column on the right (pink cell).
I would recommend either to use "Analyze OpenMP Regions" knob on analysis type or use HPC Performance Characterization where it is done by default to learn about OpenMP use efficiency by the application per lexical OpenMP regions.
Thanks & Regards, Dmitry
- Subscribe to RSS Feed
- Mark Topic as New
- Mark Topic as Read
- Float this Topic for Current User
- Bookmark
- Subscribe
- Printer Friendly Page