- Mark as New
- Bookmark
- Subscribe
- Mute
- Subscribe to RSS Feed
- Permalink
- Report Inappropriate Content
Hi,
When I install and run vtune 2021.1.2 on win10, I encountered this error:
pmu resource(s) currently being used by another profiling tool or process: another pmu collection session may be running.
I didn't open other profiling tools at the same time. So I don't know why this error appears.
The following are related infomations:
*** System Infomation:
CPU: Intel(R) Core(TM) i7-10700 CPU @ 2.90GHz
GPU: UHD 630
os: win10 64bit (OS Build 19042.804)
vtune:
Intel oneAPI VTune Profiler 2021.1.2 Patch 1
Product build: 614775
*** Steps to install vtune:
1.Download windows version from:
https://software.intel.com/content/www/us/en/develop/articles/oneapi-standalone-components.html#vtune
2.Launch the installer as administrator and choose default option in installation.
*** Steps to reproduce the issue:
1.Launch vtune as administrator
2.In "Configure Analysis", Choose "Hotspots" and then choose "Hardware Event-Based Sampling"
- Mark as New
- Bookmark
- Subscribe
- Mute
- Subscribe to RSS Feed
- Permalink
- Report Inappropriate Content
Chris,
That's wonderful! Thanks for getting back to us with your findings.
Regards,
Johny
This issue has been resolved and we will no longer respond to this thread. If you require additional assistance from Intel, please start a new thread. Any further interaction in this thread will be considered community only
Link Copied
- Mark as New
- Bookmark
- Subscribe
- Mute
- Subscribe to RSS Feed
- Permalink
- Report Inappropriate Content
I almost know which software disable PMU usage. I will double check it. Thanks!
- Mark as New
- Bookmark
- Subscribe
- Mute
- Subscribe to RSS Feed
- Permalink
- Report Inappropriate Content
Hi chris_pn,
Were you able to figure out the software that used PMU counters. If you are still unable to figure out please go through the task manager and try looking for any profilers running. Also please make sure you have only one instance of vtune profiling(amplxe-runss.exe) being run on your machine.
In case you are still unable to figure out the process from the task manager please try restarting your machine and try again.
Thanks
Arun Jose
- Mark as New
- Bookmark
- Subscribe
- Mute
- Subscribe to RSS Feed
- Permalink
- Report Inappropriate Content
Hi Arun,
I'm sure that I haven't open other profilers. But I haven't found the amplxe-runss.exe in my task-manager. The process I find is as attachment.

My computer is my corporation's. So It's high possibility that my corporation's IT software/windows os setting causes this issue. (Because our computer did some windows update & got IT software installed recently, and before this vtune is ok.) I'm contacting them for help.
Do you know which windows os setting / software will cause this issue? So I can give some hint to them. Thanks!
- Mark as New
- Bookmark
- Subscribe
- Mute
- Subscribe to RSS Feed
- Permalink
- Report Inappropriate Content
Hi Chris
Is the issue with PMU counters resolved? Is there any other information you need from our end.
Thanks
Arun
- Mark as New
- Bookmark
- Subscribe
- Mute
- Subscribe to RSS Feed
- Permalink
- Report Inappropriate Content
Hi @chris_pn,
The amplxe-runss.exe process would be present only if a vtune profiling session is running.
It would be unfathomable from our side to figure out setting/software that might be utilizing PMUs and causing the issue, as we can not be sure on what software are present on your machine.
Meanwhile could you please go to task manager>Details and check if a process with name "sep.exe" is running. I have attached a screenshot for your reference.
Arun Jose
- Mark as New
- Bookmark
- Subscribe
- Mute
- Subscribe to RSS Feed
- Permalink
- Report Inappropriate Content
Hi Arun,
The sep.exe is runing. (What I see in task-manager is 'sampling-enable-product'. It jumps to 'sep.exe' when I click 'open file location'. Please see attachments.)


I would appreciate if you could figure out the commonly-used IT software which will use PMU, but it is not a requirement. I will check with our IT team whether they have some finding. Thanks!
- Tags:
- Hi
- Mark as New
- Bookmark
- Subscribe
- Mute
- Subscribe to RSS Feed
- Permalink
- Report Inappropriate Content
Hi @chris_pn,
Could you try right click the end the sep.exe task in the task manager and try out profiling with vtune.
Thanks
Arun Jose
- Mark as New
- Bookmark
- Subscribe
- Mute
- Subscribe to RSS Feed
- Permalink
- Report Inappropriate Content
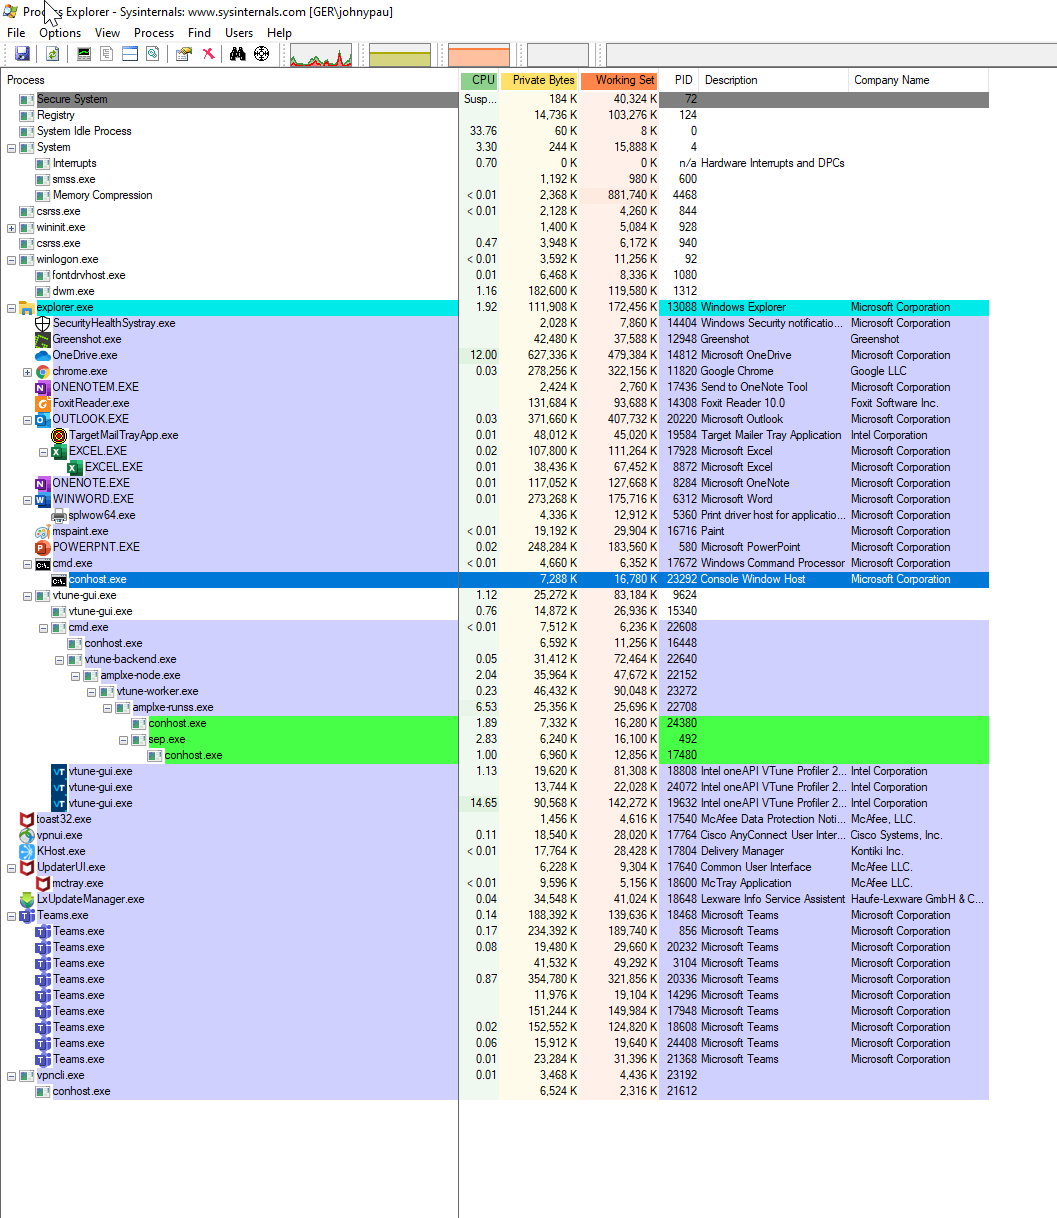
Hi Chris,
The pmu's should be utilized by the sep.exe process that is running. A Microsoft tool called Process Explorer can be used to figure out who invoked sep.exe. See the snapshot below which was captured when sep.exe was run by vtune. You can see sep.exe listed under the VTune (see green highlighted section). If vtune is the one running sep.exe you could stop the process in task manager and try profiling again. If not vtune you would get an Idea of which application uses sep.exe(which in turn uses PMUs).
Thanks
Arun Jose
- Mark as New
- Bookmark
- Subscribe
- Mute
- Subscribe to RSS Feed
- Permalink
- Report Inappropriate Content
Hi Chris,
Have you tried out the suggestion provided. Please let us know whether the issue is resolved.
Thanks
Arun
- Mark as New
- Bookmark
- Subscribe
- Mute
- Subscribe to RSS Feed
- Permalink
- Report Inappropriate Content
Hi Arun,
Thanks for your nice reply. I've tried the way you suggusted, but still fail to run vtune.
Once I start vtune with "Hardware Event-Based Sampling", the result in Process Explorer is as below:

After I kill sep.exe and rerun vtune, it still fails. And I can't find out other processes use sep.exe from Process Explorer. Seems vtune is the only user.
- Mark as New
- Bookmark
- Subscribe
- Mute
- Subscribe to RSS Feed
- Permalink
- Report Inappropriate Content
Hi Chris,
We will check on this internally and get back to you.
Thanks
Arun
- Mark as New
- Bookmark
- Subscribe
- Mute
- Subscribe to RSS Feed
- Permalink
- Report Inappropriate Content
Hi Chris,
From your snapshot (above) it looks like sep.exe was not started by VTune as its not listed below VTune. Can you please follow the steps below and share the results, so that we can confirm that VTune is not causing this issue?
- Restart your PC (if possible) and start Process Explorer. Check if you see the sep.exe is the list of running tasks. If you see it, this will help to confirm that it was not started by VTune.
- Start VTune GUI and check the process explorer for sep.exe (listed below VTune). Run and VTune analysis and check if it fails.
You already mention that killing sep.exe did not help. What happened when you killed sep.exe? Did it disappear from process explorer?
Please ensure that VTune is closed before killing sep.exe. If it stays in process explorer (with VTune GUI closed) then there is some other tasks which is starting it again immediately when its killed.
Regards,
Johny
- Mark as New
- Bookmark
- Subscribe
- Mute
- Subscribe to RSS Feed
- Permalink
- Report Inappropriate Content
Hi Johny,
I've done experiment based on your instructions:
1. Restart your PC (if possible) and start Process Explorer. Check if you see the sep.exe is the list of running tasks.
[Chris] There is no sep.exe.
2. Start VTune GUI and check the process explorer for sep.exe (listed below VTune). Run and VTune analysis and check if it fails.
[Chris] Vtune failed when enabling "Hardware event-based sampling". And I also do screen record and below are key frames:
***** After I click "Configure analysis" for official sample "matrix":


***** Then After I click "Start":


- Mark as New
- Bookmark
- Subscribe
- Mute
- Subscribe to RSS Feed
- Permalink
- Report Inappropriate Content
You already mention that killing sep.exe did not help. What happened when you killed sep.exe? Did it disappear from process explorer?
[Chris] Yes, it disappear from process explorer.
Please ensure that VTune is closed before killing sep.exe. If it stays in process explorer (with VTune GUI closed) then there is some other tasks which is starting it again immediately when its killed.
[Chris] No matter vtune is closed or not, sep.exe will NOT be started again immediately when its killed.
- Mark as New
- Bookmark
- Subscribe
- Mute
- Subscribe to RSS Feed
- Permalink
- Report Inappropriate Content
Let's simplify the collection and run without vtune-gui.
Could you reboot machine and run sep.exe directly?
VTUNE_DIR/bin64/sep.exe -start -d 3is it hang? what is the process tree? is sep_modules.exe there?
Kirill
- Mark as New
- Bookmark
- Subscribe
- Mute
- Subscribe to RSS Feed
- Permalink
- Report Inappropriate Content
Hi Kirill,
It can run successfully from command line. sep.exe can run about 3 seconds and then exit.
Below is related screenshot:
Before run `VTUNE_DIR/bin64/sep.exe -start -d 3`:

Start Running `VTUNE_DIR/bin64/sep.exe -start -d 3`:

About some seconds later:

- Mark as New
- Bookmark
- Subscribe
- Mute
- Subscribe to RSS Feed
- Permalink
- Report Inappropriate Content
Does collection produced collector file? something like xxxx.tb7? could you import it to vtune gui and share screenshot?
Another question is about sep_modules.exe. Was this process in process tree all time? For example, if you run 'sep.exe -start -d 60', will it be 60 secs?
Kirill
- Mark as New
- Bookmark
- Subscribe
- Mute
- Subscribe to RSS Feed
- Permalink
- Report Inappropriate Content
Chris,
Did you get a chance to look at the questions from Kirill (mentioned above)?
Regards,
Johny
- Mark as New
- Bookmark
- Subscribe
- Mute
- Subscribe to RSS Feed
- Permalink
- Report Inappropriate Content
Chris,
Has your issue been resolved? If I don't hear from you within 5 business days, I will assume your support request is resolved and you no longer need assistance
Regards,
Johny
- Mark as New
- Bookmark
- Subscribe
- Mute
- Subscribe to RSS Feed
- Permalink
- Report Inappropriate Content
Hi Johny,
After working with my IT colleagues, we have confirmed that one of IT sofeware causes this vtune issue. (If uninstall this IT software, vtune hardware event based sampling works fine.) Thanks for your support. I think this topic can be closed now. I'll open another topic if I need your help. Thanks again!
- Subscribe to RSS Feed
- Mark Topic as New
- Mark Topic as Read
- Float this Topic for Current User
- Bookmark
- Subscribe
- Printer Friendly Page