- Mark as New
- Bookmark
- Subscribe
- Mute
- Subscribe to RSS Feed
- Permalink
- Report Inappropriate Content
I expect GPU inference time less than of CPU inference time. But the inference time taken for GPU is more than CPU inference. I am running inference for 30 minutes video of resolution (1280x720) in both CPU and GPU mode. The details are below.
I used object_detection_demo_ssd_async.exe and person-detection-retail-0013.xml(FP32) model.
opeVino Version: computer_vision_sdk_2018.3.343
System details.
Processor : intel(r) xeon(r) cpu e3-1505m v5 @ 2.80ghz
RAM : 32 GB
type : 64 bit - Windows 10
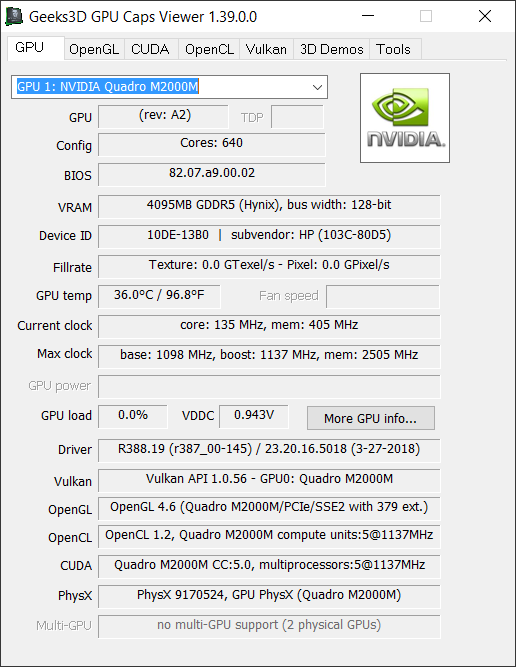
GPU 1: NVIDIA Quadro M2000M
GPU 2: Intel(R) HD Graphics P530
1. CPU
-i Input(1).mp4 -m C:\Intel\computer_vision_sdk_2018.3.343\deployment_tools\intel_models\person-detection-retail-0013\FP32\person-detection-retail-0013.xml -d CPU
InferenceEngine:
API version ............ 1.2
Build .................. 13911
[ INFO ] Parsing input parameters
[ INFO ] Reading input
[ INFO ] Loading plugin
API version ............ 1.2
Build .................. win_20180511
Description ....... MKLDNNPlugin
[ INFO ] Loading network files
[ INFO ] Batch size is forced to 1.
[ INFO ] Checking that the inputs are as the sample expects
[ INFO ] Checking that the outputs are as the sample expects
[ INFO ] Loading model to the plugin
Inference time (per image) : 12.25 ms
2.GPU
-i Input(1).mp4 -m C:\Intel\computer_vision_sdk_2018.3.343\deployment_tools\intel_models\person-detection-retail-0013\FP32\person-detection-retail-0013.xml -d GPU
InferenceEngine:
API version ............ 1.2
Build .................. 13911
[ INFO ] Parsing input parameters
[ INFO ] Reading input
[ INFO ] Loading plugin
API version ............ 1.2
Build .................. cldnn/GEN_GPU_clDNN_ci-main_cldnn-main-03988_artifacts.zip
Description ....... clDNNPlugin
[ INFO ] Loading network files
[ INFO ] Batch size is forced to 1.
[ INFO ] Checking that the inputs are as the sample expects
[ INFO ] Checking that the outputs are as the sample expects
[ INFO ] Loading model to the plugin
[ INFO ] Start inference
Inference time(per image) : 48.95 ms
Please help me to configure so GPU inference runs faster than CPU. Please find the attachment for Display Adapter and OpenCL Info. Do I need to do any graphics configuration to make it run fast in GPU. I would like to expect anyone support to solve this issue.
Thanks
Link Copied
- Mark as New
- Bookmark
- Subscribe
- Mute
- Subscribe to RSS Feed
- Permalink
- Report Inappropriate Content
Hello Sharfudheen,
Your numbers looks good. In some cases fast CPUs can execute inference faster than slower GPUs. I too can experience this issue in many configurations in some of my systems in the lab. In your case the P530 does not have so many EUs, like the P580 for example ( https://www.intel.com/content/dam/www/public/us/en/documents/guides/hd-graphics-p530-p580-performance-guide.pdf ; , https://ark.intel.com/products/89608/Intel-Xeon-Processor-E3-1505M-v5-8M-Cache-2-80-GHz- )
I would suggest to run on GPU with the FP16 IR and FP32 for CPU. In your case you run FP32 on GPU:
-i Input(1).mp4 -m C:\Intel\computer_vision_sdk_2018.3.343\deployment_tools\intel_models\person-detection-retail-0013\FP32\person-detection-retail-0013.xml -d GPU
try something like
-i Input(1).mp4 -m C:\Intel\computer_vision_sdk_2018.3.343\deployment_tools\intel_models\person-detection-retail-0013\FP16\person-detection-retail-0013.xml -d GPU
is it faster now? Will still be slower than your quad core CPU but there are other benefits , like power efficiency. Also the CPU will not be as loud when on GPU path.
Cheers,
Nikos
- Mark as New
- Bookmark
- Subscribe
- Mute
- Subscribe to RSS Feed
- Permalink
- Report Inappropriate Content
Hi Nikos,
Thanks for the reply. I have tried with FP16 model as well and result is as below.
FP16 - 32.56 ms (GPU)
FP32 - 48.95 (GPU)
FP32 - 12.25 ms (CPU)
I am able handle 4 camera inference in realtime in CPU and would like handle more number of camera inference using GPU capability.
My system has in built Intel (R) HD Graphics P530 and NVIDIA Quadro M2000M and both are configured by OpenCL 1.2 Quadro M2000M.
How do I ensure inference is completely utilizing the GPU capability?. Please have a look into above attached images for system GPU details.
I have tried running the exe (GPU mode) after disabling the NVIDIA Quadro M2000M GPU from Device manager but didnt see any improvements in inference time.
It will be great help if someone can guide me to resolve this issue.
Thanks in advance
Sharaf
- Mark as New
- Bookmark
- Subscribe
- Mute
- Subscribe to RSS Feed
- Permalink
- Report Inappropriate Content
Hi Sharaf,
> FP16 - 32.56 ms (GPU)
> FP32 - 48.95 (GPU)
FP16 is faster than FP32 so you can use FP16 on GPU if have no accuracy issues.
To analyze your four-camera pipeline you really need to use profilers (like VTune or other CPU or OpenCL / GPU profilers).
Also try to connect one monitor directly to the system HDMI (not to the NVIDIA GPU) so Intel GPU clocks get higher (?). Did not help me here though. Not sure where the bottleneck may be for 4 cameras - we need to see end-to-end system profiling traces.
Another idea may be use the HETERO plug-in so that you run on both CPU and GPU devices. Have tried already?
To be honest I am not sure what the real issue is here. It is a fact that for this particular network GPU runs slower on my HD630 system too. My Core i7 CPU take 6ms and my HD630 GPU 29ms.
mbox_conf1/out/conv/flat/r... NOT_RUN        layerType: Reshape            realTime: 0          cpu: 0              execType: unknown
mbox_conf1/out/conv/flat/s... EXECUTED       layerType: SoftMax            realTime: 108        cpu: 108            execType: ref_any
mbox_conf1/out/conv/flat/s... NOT_RUN        layerType: Flatten            realTime: 0          cpu: 0              execType: unknown
mbox_conf1/out/conv/perm      EXECUTED       layerType: Permute            realTime: 11         cpu: 11             execType: unknown
mbox_loc1/out/conv            EXECUTED       layerType: Convolution        realTime: 313        cpu: 313            execType: jit_avx2
mbox_loc1/out/conv/flat       NOT_RUN        layerType: Flatten            realTime: 0          cpu: 0              execType: unknown
mbox_loc1/out/conv/perm       EXECUTED       layerType: Permute            realTime: 24         cpu: 24             execType: unknown
out_detection_out             NOT_RUN        layerType: Output             realTime: 0          cpu: 0              execType: unknown
Total time: 6365     microseconds
[ INFO ] Execution successful
and the HD 630 is slower
mbox1/priorbox_cldnn_custo... NOT_RUN        layerType: Reorder            realTime: 0          cpu: 0              execType: undef
mbox_conf1/out/conv           EXECUTED       layerType: Convolution        realTime: 257        cpu: 2              execType: convolution_gpu_bfyx_os_iyx_osv16
mbox_conf1/out/conv/flat      OPTIMIZED_OUT  layerType: Flatten            realTime: 0          cpu: 0              execType: undef
mbox_conf1/out/conv/flat/r... OPTIMIZED_OUT  layerType: Reshape            realTime: 0          cpu: 0              execType: undef
mbox_conf1/out/conv/flat/s... EXECUTED       layerType: SoftMax            realTime: 6          cpu: 2              execType: softmax_gpu_ref
mbox_conf1/out/conv/flat/s... OPTIMIZED_OUT  layerType: Flatten            realTime: 0          cpu: 0              execType: undef
mbox_conf1/out/conv/perm      EXECUTED       layerType: Permute            realTime: 16         cpu: 2              execType: permute_ref
mbox_loc1/out/conv            EXECUTED       layerType: Convolution        realTime: 265        cpu: 2              execType: convolution_gpu_bfyx_os_iyx_osv16
mbox_loc1/out/conv/flat       OPTIMIZED_OUT  layerType: Flatten            realTime: 0          cpu: 0              execType: undef
mbox_loc1/out/conv/perm       EXECUTED       layerType: Permute            realTime: 23         cpu: 2              execType: permute_ref
Total time: 291134   microseconds
[ INFO ] Execution successful
JFTR if you use -pc you will see an analysis of what layers run slow and maybe you can think of other optimization options.
Cheers,
Nikos
- Mark as New
- Bookmark
- Subscribe
- Mute
- Subscribe to RSS Feed
- Permalink
- Report Inappropriate Content
HETERO did not help too much in my case.
The only other option is batching, that may be the only option to support four cameras in real-time.
- Mark as New
- Bookmark
- Subscribe
- Mute
- Subscribe to RSS Feed
- Permalink
- Report Inappropriate Content
Hi Nikos,
Thanks for reply. I don't have problem with accuracy. My concern is performance (inference time).
I have tried in a system with different configuration (Core i7 CPU + Intel(R) HD Graphics 530 + NVIDIA GrForce GTX 950M )and still facing the same issue( GPU inference slower than CPU inference).
I tried batch processing as well couldn't see much improvements in performance ( Batch size - 5). I think some problem with GPU utilization for inference but it's not showing any message or error.
Please have a look into attached NVIDIA Quadro M2000M.png and Intel HD graphics.png file. There is no current clock and max clock value for Intel HD graphics.
Is there any software can used see GPU utilization? I am using windows 10 - 1703 version( we cant see GPU utilization in task manager in this version)
Regards,
Sharaf
- Mark as New
- Bookmark
- Subscribe
- Mute
- Subscribe to RSS Feed
- Permalink
- Report Inappropriate Content
VTune ( https://software.intel.com/en-us/vtune ) is the best profiler that can also show you GPU utilization and OpenCL timeline.
Also try https://github.com/openhardwaremonitor but you may have to compile from source and change device IDs . It should be able to show GPU load.
You could also move your windows to 1803 and see load without any tools.
Cheers,
Nikos
- Mark as New
- Bookmark
- Subscribe
- Mute
- Subscribe to RSS Feed
- Permalink
- Report Inappropriate Content
Hi Nikos,
Thanks.
Can someone suggest any GPU / configuration where object_detection_demo_ssd_async.exe runs faster in GPU than CPU (windows )?
I would like to hear from you all.
Regards,
Sharaf
- Subscribe to RSS Feed
- Mark Topic as New
- Mark Topic as Read
- Float this Topic for Current User
- Bookmark
- Subscribe
- Printer Friendly Page