链接已复制
The subroutine does not know the size of the array from the caller's argument. Instead, when using y(*) you must pass the size by some other means: additional argument, terminating value (999999) something like this.
To pass the size of array y, use an interface of y(:)
This is the assumed shape argument passing method. You get shape and sizes within each shape.
Jim Dempsey
I took the ECDC data file for April 5, 2020, and plotted log(Ndeaths) against log(Ncases) for three countries: USA (blue), Spain (black) and Italy (red). On the plot, adjacent circles represent successive days. Both Ncases and Ndeaths are cumulative sums of the data in the CSV file from ECDC.
Since dates are not represented explicitly, the fact that rapid growth started on different dates in different countries does not distort this phase-plane plot. The lines for Italy and Spain are quite similar, with Spain showing a slightly faster growth and possibly set to overtake Italy. The plot for the US shows significant curvature, but I hope that the trend will be changed by the countermeasures being taken now.
I am trying to write a paper about this analysis, can I use your picture please -- I will acknowledge the source. Great analysis by the way.
The US is in deep trouble -- the measures may help move the curve down but the underlying math from the Beast is terrible.
I have the 7 equation model working -- thank god for Numerical Recipes in Fortran.
The death toll is held low at the moment with all those people on ventilators -- 80% will not come off - what is living death?
Feel free to use the plot as you please. No acknowledgement needed -- it is a simple plot of public data from ECDC. The lines are least squares fits (polynomials of degree 2) to log(Ndeaths) in terms of log(Ncases) with a few of the low end data excluded from the fits.
Blue is the US population with the standard numbers estimated from Wuhan - yellow is US current
Now to play with Wuhan variables to match the data
If the beast got into USA first we would have a blood bath --
  !  y(1) is susceptible
    !  y(2) is exposed
    !  y(3) is infected
    !  y(4) is quarantined
    !  y(5) is recovered
    !  y(6) is Death
    !  y(7) is Insusceptible

    dydx(1) = -NBeta*y(1)*y(3) - alpha*y(1)                             ! Equation 1 -
    dydx(2) = (Nbeta*y(1)*y(3)) - gamma*y(2)                             ! Equation 2
    dydx(3) = gamma*y(2) - delta*y(3)                                  ! Equation 3
    dydx(4) = delta*y(3) - lambda*y(4) - kappa*y(4)                    ! Equation 4
    dydx(5) = lambda*y(4)                                              ! Equation 5
    dydx(6) = kappa* y(4)                                              ! Equation 6 - correct
    dydx(7) = alpha*y(1)                                               ! Equation 7
Alpha is the variable that is the protection variable -- I wonder why given all other variable constant the alpha has a sixth order polynomial form.
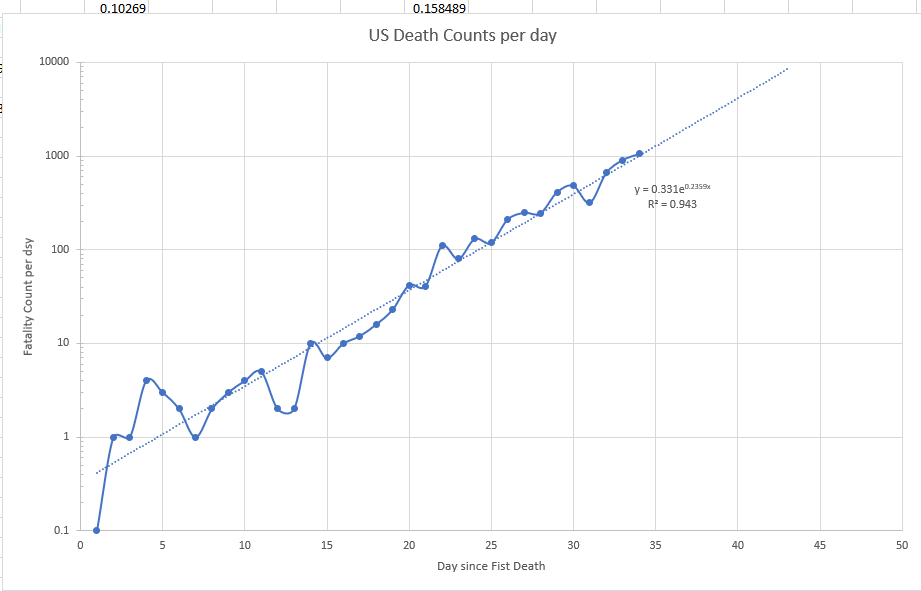
The curve above shows the ODE Solution for the Chinese equations including estimating deaths. The red is the US deaths assuming same start date with one death.
Dear All:
Why do you think the ODE has the wrinkle in the solution at the top of the curve? This also occurs on the HIME University of Washington Models -- so I assume they are using a similar ODE.
This is for the standard data from Wuhan, but the alpha value from Wuhan is just way off the scale.
JMN
I used the MKL RANDOM
!===============================================================================
! Copyright 2003-2020 Intel Corporation.
!
! This software and the related documents are Intel copyrighted  materials,  and
! your use of  them is  governed by the  express license  under which  they were
! provided to you (License).  Unless the License provides otherwise, you may not
! use, modify, copy, publish, distribute,  disclose or transmit this software or
! the related documents without Intel's prior written permission.
!
! This software and the related documents  are provided as  is,  with no express
! or implied  warranties,  other  than those  that are  expressly stated  in the
! License.
!===============================================================================

!  Content:
!    vdRngGaussian  Example Program Text
!*******************************************************************************

      include 'mkl_vsl.f90'
      include "errcheck.inc"

      program MKL_VSL_TEST

      USE MKL_VSL_TYPE
      USE MKL_VSL

      integer(kind=4) i,nn
      integer n
      integer(kind=4) errcode

      real(kind=8) a,sigma
      real(kind=8) r(1000000)
      integer brng,method,seed

      real(kind=8) tM,tD,tQ,tD2
      real(kind=8) sM,sD
      real(kind=8) sum, sum2
      real(kind=8) s
      real(kind=8) DeltaM,DeltaD

      TYPE (VSL_STREAM_STATE) :: stream

      n=1000000
      nn=10

      brng=VSL_BRNG_MCG31
      method=VSL_RNG_METHOD_GAUSSIAN_ICDF
      seed=777

      a=0.0
      sigma=1.0

!     ***** Initialize *****
      errcode=vslnewstream( stream, brng,  seed )
      call CheckVslError(errcode)

!     ***** Call RNG *****
      errcode=vdrnggaussian( method, stream, n, r, a, sigma)
      call CheckVslError(errcode)

!     ***** Theoretical moments *****
      tM=a
      tD=sigma*sigma
      tQ=720.0*sigma*sigma*sigma*sigma

!     ***** Sample moments *****
      sum=0.0
      sum2=0.0
      do i=1,n
        sum=sum+r(i)
        sum2=sum2+r(i)*r(i)
      end do
      sM=sum/n
      sD=sum2/n-sM*sM

!     ***** Comparison of theoretical and sample moments *****
      tD2=tD*tD
      s=((tQ-tD2)/n)-(2*(tQ-2*tD2)/(n*n))+((tQ-3*tD2)/(n*n*n))
      DeltaM=(tM-sM)/sqrt(tD/n)
      DeltaD=(tD-sD)/sqrt(s)

!     ***** Printing results *****
      print *,"Sample of vdRngGaussian."
      print *,"------------------------"
      print *,""
      print *,"Parameters:"
      print 11,"    a=",a
      print 11,"    sigma=",sigma

      print *,""
      print *,"Results (first 10 of 1000):"
      print *,"---------------------------"
      open(1,file='rand.out',status='unknown')
      do i=1,1000000
        print 10,r(i)
        write(1,*)r(i)
      end do

      print *,""
      if (abs(DeltaM)>3.0 .OR. abs(DeltaD)>3.0) then
        print 12,"Error: sample moments (mean=",                        &
     &    sM,", variance=",sD,                                          &
     &    ") disagree with theory (mean=",                              &
     &    tM,", variance=",tD,")."
        stop 1
      else
        print 12,"Sample moments (mean=",sM,                            &
     &    ", variance=",sD,") agree with theory (mean=",                &
     &    tM,", variance=",tD,")."
      end if

!     ***** Deinitialize *****
      errcode=vsldeletestream( stream )
      call CheckVslError(errcode)

10    format(F7.3)
11    format(A,F5.3)
12    format(A,F5.2,A,F5.2,A,F5.2,A,F5.2,A)

      end
I used the Random number generator from MKL to create 1000000 randoms numbers to create a Weiner Process (I think) and then used the number at each look pt create a value for lambda that varied by a max of 2% and the results is above.
2% is nothing.


