- Mark as New
- Bookmark
- Subscribe
- Mute
- Subscribe to RSS Feed
- Permalink
- Report Inappropriate Content
Hello all,
I'm using the Transceiver Toolkit to generate an eye diagram for the characterization of a Stratix V based setup. I already managed to do that using a firmware created by a colleague. I could understand that it shifts the sampling time in order to get the BER of every phase step, and from the BER it gets the eye diagram because the BER is directly related to the eye width. From this, I could expect that it should be a single value of BER per phase step, which means a single line. But in the eye diagram I see multiple lines. What are those lines?! Also in the report generated I see multiple BER per phase step. Why? What parameter is changing for it to make multiple BER measurements from the same phase step? Also what does the vertical axis (from -63 to 63) means exactly? Is it just an arbitrary scale to represent the BER? Is the formula to convert from BER documented somewhere? You can see the multiple lines in the image below. (representing multiple BER measurements for each phase step) Is every line representing a BER measured for a specific bit pattern maybe? Like the outer line is measured whenever the pattern is 111 and the inner one when it is 010 (which would cause a higher BER). Please if someone could clarify this matter for me I would be very grateful :) Thanks, http://www.alteraforum.com/forum/attachment.php?attachmentid=13124&stc=1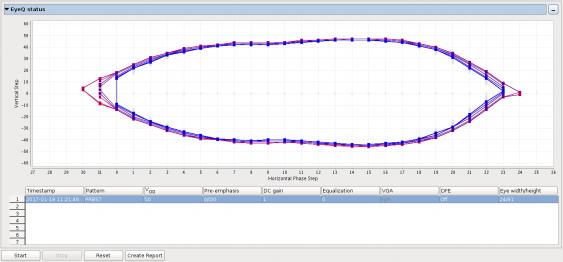
Link Copied
2 Replies
- Mark as New
- Bookmark
- Subscribe
- Mute
- Subscribe to RSS Feed
- Permalink
- Report Inappropriate Content
--- Quote Start --- Is every line representing a BER measured for a specific bit pattern maybe? --- Quote End --- I believe the multiple lines are just estimates of bit-error rates. The eye pattern scan tool can be setup to perform bit-error-rates in a couple of ways. The easiest one to understand is the XOR mode - the received signal is split two ways; the normal path and the delayed/offset path. The grid you see in your eye pattern measurement is the bit-error rate at each setting of delay step (x-axis) and offset/voltage (y-axis). The bit error count is the number of times the normal path bit does not match the delayed/offset path, i.e., the number of times the XOR gives an output of 1 (when the inputs are different). The shape of the eye pattern changes depending on what PRBS/LFSR signal you send it. Check out these slides for some heat-map images; https://www.ovro.caltech.edu/~dwh/correlator/pdf/hawkins_jpl_2014.pdf The top of this page has a couple of documents I wrote for the Transceiver Toolkit https://www.ovro.caltech.edu/~dwh/correlator/cobra_docs.html There may be some additional info in there of use to you. The Arria V GZ transceivers are the same as the Stratix V, so make sure to look at that document too. Cheers, Dave
- Mark as New
- Bookmark
- Subscribe
- Mute
- Subscribe to RSS Feed
- Permalink
- Report Inappropriate Content
Hello Dave,
Thank you for your answer. --- Quote Start --- is the bit-error rate at each setting of delay step (x-axis) and offset/voltage (y-axis). --- Quote End --- I think this is the point I'm missing! I could see in your slides that you say: "The receiver has a phase-interpolator and voltage-offset generator" So it can actually offset the voltage in the receiver input? Now I think I get it. It shifts the phase and for each phase, it starts shifting the voltage-offset until you reach the target BER. Is that it? Is it made by the same block responsible for the Offset Cancellation? Is it actually how it calibrates for the best Offset? Thank you for you the clarifying answer and for sharing the documents! Cheers, Mauricio
Reply
Topic Options
- Subscribe to RSS Feed
- Mark Topic as New
- Mark Topic as Read
- Float this Topic for Current User
- Bookmark
- Subscribe
- Printer Friendly Page