- Mark as New
- Bookmark
- Subscribe
- Mute
- Subscribe to RSS Feed
- Permalink
- Report Inappropriate Content
Hi,
I'd like to write a simple sample to demonstrate the out-of-order execution model and synchronization mechanism based on events. It seems work on intel opencl platform but the schedule of command is different each time. The sample is simple.There are three kernels: empty, caesarCipher and divergence.
Kernel caesarCipher and deivergence need source data. So there five main steps includes writing two data buffer and executing three kernel.//The most simple kernel. Just do nothing
__kernel void empty(){
return;
}
//Naive cipher.
__kernel void caesarCipher(__global char* plainText){
size_t id=get_global_id(0);
plainText[id]=(plainText[id]+id)%256;
}
//Simple divergence computation for 1D data.
__kernel void divergence(__global float* fieldData, __global float* divergenceData, float factor){
size_t id=get_global_id(0);
float upValue=fieldData[id];
float bottomValue=upValue;
if(id>=2){
bottomValue=fieldData[id-2];
}
size_t globalSize=get_global_size(0);
if(idupValue=fieldData[id+2];
}
divergenceData[id]=(upValue-bottomValue)*factor;
}
clCommandQueue= cl::CommandQueue(clContext, *(clDevices.begin()),CL_QUEUE_PROFILING_ENABLE|CL_QUEUE_OUT_OF_ORDER_EXEC_MODE_ENABLE,
&clError);
cl::Kernel emptyKernel(clProgram, "empty");
cl::Kernel divergenceKernel(clProgram, "divergence");
cl::Kernel caesarCipherKernel(clProgram, "caesarCipher");
//Data buffer
cl::Buffer plaintextBuffer(clContext, CL_MEM_READ_WRITE, num*sizeof(cl_char));
cl::Buffer fieldDataBuffer(clContext, CL_MEM_READ_ONLY, num*sizeof(cl_float));
cl::Buffer divergenceDataBuffer(clContext, CL_MEM_WRITE_ONLY, num*sizeof(cl_float));
caesarCipherKernel.setArg<:Buffer> (0, plaintextBuffer);
divergenceKernel.setArg<:Buffer> (0, fieldDataBuffer) ;
divergenceKernel.setArg<:Buffer> (1, divergenceDataBuffer) ;
divergenceKernel.setArg(2, 0.25) ;
cl::Event writePlainTextEvent;
cl::Event writeFieldDataEvent;
cl::Event executeEmptyKernelEvent;
cl::Event executeCaesarKernelEvent;
cl::Event executeDivergenceKernelEvent;
//Write source data for kernel divergence
clCommandQueue.enqueueWriteBuffer(fieldDataBuffer, CL_FALSE, 0, num*sizeof(cl_float), fieldData.data(), NULL, &writeFieldDataEvent);
//Execute the kernel empty
clCommandQueue.enqueueNDRangeKernel(emptyKernel, cl::NullRange, cl::NDRange(num), cl::NullRange,NULL,&executeEmptyKernelEvent);
//Execute the kernel divergence
std::vector<:Event> divergenceWaitEvents;
divergenceWaitEvents.push_back(writeFieldDataEvent);
clCommandQueue.enqueueNDRangeKernel(divergenceKernel, cl::NullRange, cl::NDRange(num), cl::NullRange,&divergenceWaitEvents,&executeDivergenceKernelEvent);
//Write source data for kernel caesarCipher
clCommandQueue.enqueueWriteBuffer(plaintextBuffer, CL_FALSE, 0, num*sizeof(cl_char),plaintext.data(),NULL,&writePlainTextEvent) ;
//Execute the kernel caesarCipher
std::vector<:Event> caesarCipherWaitEvents;
caesarCipherWaitEvents.push_back(writePlainTextEvent);
clCommandQueue.enqueueNDRangeKernel(caesarCipherKernel, cl::NullRange, cl::NDRange(num), cl::NullRange,&caesarCipherWaitEvents,&executeCaesarKernelEvent);
clCommandQueue.finish();
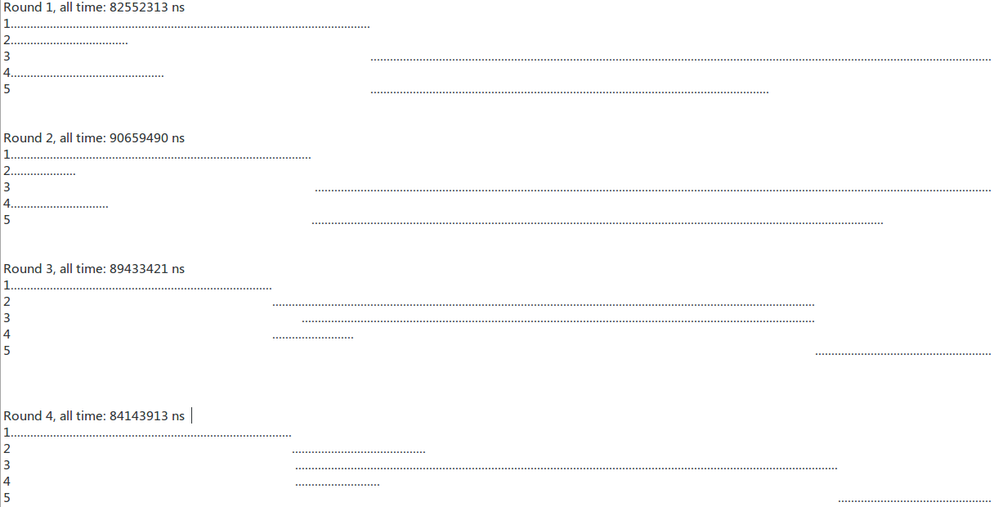
I run the sample on openSUSE 12.1 with core i5-2500k using Intel OpenCL SDK 1.5. The start-finish schedule is shown based on profiling info like this.
Line 1. Write data to fieldDataBuffer
Line2. Execute the kernel empty
Line3. Execute the kernel divergence
Line4. Write data to plaintextBuffer
Line5. Execute the kernel caesarCipher

Is it right or my codes has problems? Are there some materials and samples about the our-of-order schedule andsynchronization for intel platform?
Besides, I have tried to profile the sample using Intel VTune Amplifier but the result graph is not clear for opencl kernel. Are there some other tools for intel opencl platform which can show the profiling info clearly like Nvidia Visual Profiler?
Thanks!
Link Copied
6 Replies
- Mark as New
- Bookmark
- Subscribe
- Mute
- Subscribe to RSS Feed
- Permalink
- Report Inappropriate Content
Hello,
Your code seems okay (though I'm curious: what is "num" for these graphs?)
There is a free tool called Intel Graphics Performance Analyzer which is documented in section 5.3 of the user guide (http://software.intel.com/file/39188) and is meant exactly for this sort of debugging. Unfortunately it doesn't have a Linux version yet.
I'll try to reproduce your workload locally and we'll see whether my results match yours. Just to make sure I understand, what you're not expecting is the 8 ms variance between runs, right?
Thanks,
Doron Singer
- Mark as New
- Bookmark
- Subscribe
- Mute
- Subscribe to RSS Feed
- Permalink
- Report Inappropriate Content
Hello,
Thanks for your quick reply!
Your code seems okay (though I'm curious: what is "num" for these graphs?)
The num is the number of source data. These are the codes which just produce meaningless data for test.
size_t num=30000000;std::vectorplaintext(num); for(int i=0;ifieldData(num); for(int i=0;i
I am confused about the execution order of commands in queue. For round 1 and round2 command 1 (Write data to fieldDataBuffer) command2 (Execute the kernel empty) and command 4(Write data to plaintextBuffer) executed simultaneously from the beginning and after the finish of all of them command3 (Execute the kernel divergence) andcommand5 (Execute the kernel caesarCipher) began. This order seems ok exceptcommand5 (Execute the kernel caesarCipher) didn't begin at once after the finish ofcommand4 (Write data to plaintextBuffer).
But for round 3 and round 4command2 (Execute the kernel empty) andcommand 4(Write data to plaintextBuffer) didn't executed at the beginning. They waited for the finish ofcommand 1 (Write data to fieldDataBuffer). Andcommand5 (Execute the kernel caesarCipher) also waited for the finish ofcommand3 (Execute the kernel divergence). So this order seems to be not optimized. Strangely the total execution time is less than round 1 and round 2.
The order I expected is like the round 1 butcommand5 (Execute the kernel caesarCipher) should begin to execute just after the finish ofcommand 4(Write data to plaintextBuffer).
Can you give me some info about the commands schedule of out-of-order execution mode? Are they executed randomly based on the resources currently? Or there are some optimized approaches.
Thanks a lot!
ZHAO Peng
- Mark as New
- Bookmark
- Subscribe
- Mute
- Subscribe to RSS Feed
- Permalink
- Report Inappropriate Content
Hello again and thanks for sharing the rest of the benchmark with us.
The way scheduling works in OOO queues isn't exactly "random"... more like "unpredictable". There is no clear preference to latency or throughput - instead the threading system tries to utilize the threads as much as possible, using task-stealing techniques.
However, it's reasonable to expect that such best utilization (and the time it takes), given a constant dependency graph, won't change too much between invocations, which is why I'd like to try and reproduce what you're seeing and get back to you.
Thanks,
Doron Singer
- Mark as New
- Bookmark
- Subscribe
- Mute
- Subscribe to RSS Feed
- Permalink
- Report Inappropriate Content
Hello again,
I believe you'll find with the newly-released SDK the schedule is more consistent. You may also notice it's sub-optimal, as everything you submit to the queue will end up being blocked by the first clEnqueueWriteBuffer - we plan on addressing this towards a future release.
Thanks for reporting this issue.
Doron Singer
- Mark as New
- Bookmark
- Subscribe
- Mute
- Subscribe to RSS Feed
- Permalink
- Report Inappropriate Content
Hello,


Thanks for your information and good work! I am really glad that Intel keeps rapid development on OpenCL SDK.
I tried my sample again using the new SDK and the profile results are as follow. I have written my own tool to show the profile graph. :) I hope these results can help.
Round 1

Round 2

Round 3

Round 4

Round 5

Round 6

From the round 3 to round 6 the results are very consistent. Only the round 1 and round 2 are very different. I am not clear about the "sub-optimal" you mention. From my results theclEnqueueWriteBuffer didn't block the followed commands. Do these results match yours?
Anyway I can see the better performance than the old SDK. And I am looking forward to the next release.
Thanks again!
ZHAO Peng
- Mark as New
- Bookmark
- Subscribe
- Mute
- Subscribe to RSS Feed
- Permalink
- Report Inappropriate Content
Interesting, your results are better than what I'm seeing. I keep seeing the picture you see in 1/2. Our goal is to have the picture you see in 3 and above, where everything that can run in parallel does.
By the way, it seems like you wrote your own visualization code. If you're using a Windows-based OS, you might want to consider running the same tests using Intel's free GPA tool - you can read more about it here:
http://software.intel.com/sites/landingpage/opencl/user-guide/Using_the_Intel_Graphics_Performance_Analyzers_(Intel_GPA)_Platform_Analyzer.htm
Thanks,
Doron
Reply
Topic Options
- Subscribe to RSS Feed
- Mark Topic as New
- Mark Topic as Read
- Float this Topic for Current User
- Bookmark
- Subscribe
- Printer Friendly Page