- Mark as New
- Bookmark
- Subscribe
- Mute
- Subscribe to RSS Feed
- Permalink
- Report Inappropriate Content
Hi,
Usually I work with VTune GUI both for performance measurement and for results analysis.
At my work recently I have started to use VTune CLI to run analysis and report the results, because we try to introduce automated profiling test runs.
I'm interested mainly in custom analysis of "runsa" type and "uarch-exploration", but I'm not able to generate any results beside scarce "summary" report. I used two types of report command:
- Hotspots -- no generated results
- hw-events -- no generated results
The vtune.log did not indicate any serious problem, beside warning in regards to PEBS events not collected in VM environment. There was no any error in regards to "report" functionality.
I would like to know which "reports" are compatible with custom runsa and with uarch-exploration analysis.
Thank your for your help
--Bernard
- Mark as New
- Bookmark
- Subscribe
- Mute
- Subscribe to RSS Feed
- Permalink
- Report Inappropriate Content
Yes you can use events modifiers which can be specified together with event delimited by colon. For example, this string:
MEM_INST_RETIRED.ALL_LOADS:sa=100000:os=no
will set period to 100000 and disable counting on 0 privilege level for the MEM_INST_RETIRED.ALL_LOADS event.
You can find the list of all supported modifiers and their descriptions in the SEP user guide here: https://software.intel.com/content/www/us/en/develop/download/sep-user-guide.html
Look for 'Event Modifiers' section.
Link Copied
- Mark as New
- Bookmark
- Subscribe
- Mute
- Subscribe to RSS Feed
- Permalink
- Report Inappropriate Content
Hi.
is it possible to share /tmp/vtune_data result?
Kirill
- Mark as New
- Bookmark
- Subscribe
- Mute
- Subscribe to RSS Feed
- Permalink
- Report Inappropriate Content
Hi Kirill,
Thank you quick response.
I'm attaching a 4 files (zipped) generated by the perf collector.
Please let me know if you need additional files.
--Bernard
- Mark as New
- Bookmark
- Subscribe
- Mute
- Subscribe to RSS Feed
- Permalink
- Report Inappropriate Content
I need one more file. something like systemcollector-2284-nntpat98-59.sc.
I added all attached files to 'result' dir and called import
vtune.exe -r result -import
after that I generated all types of reports that you mentioned
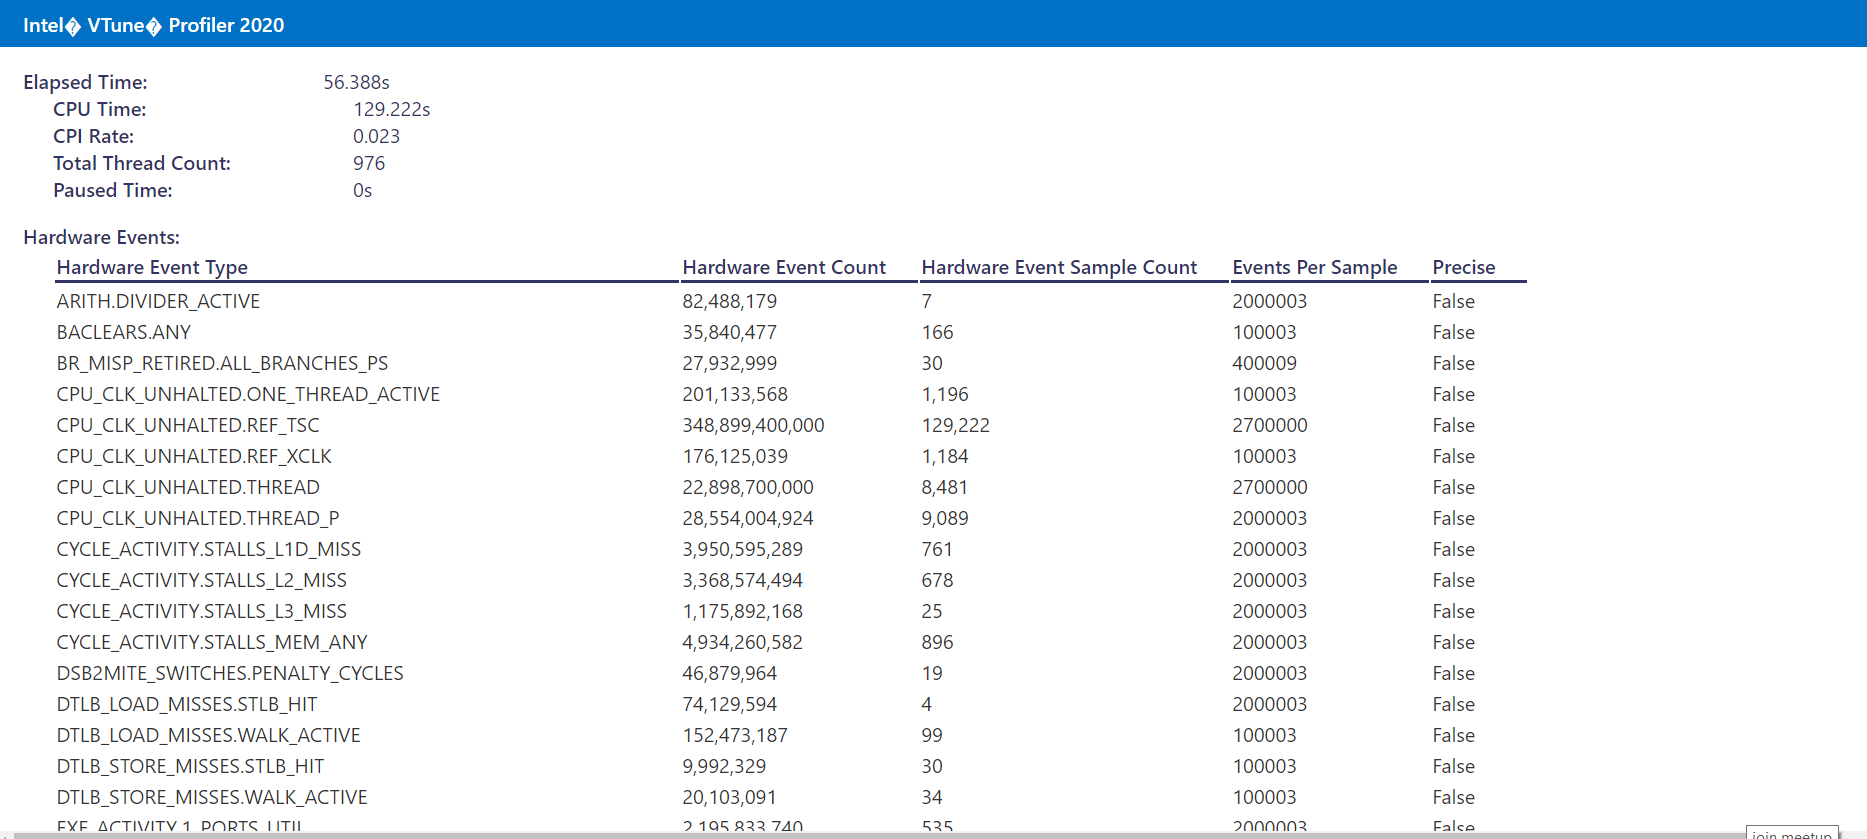
summary, html summary, hotspots, hw-events
- Mark as New
- Bookmark
- Subscribe
- Mute
- Subscribe to RSS Feed
- Permalink
- Report Inappropriate Content
Hi Kirill,
I do not have an access to our remote server now, and I will provide that file (.sc) on Monday.
after that I generated all types of reports that you mentioned
summary, html summary, hotspots, hw-events
Can you post the exact 'report' command for following reports types?
-- hotspots
-- hw-events
-- summary
In my case only a report "hotspot" worked for a -collection hotspot.
Now the question is -- which "report" commands work with which analysis types? Do following reports: "hotspots, hw-events, top-down, summary, callstacks, gprof-cc" work with "uarch-exploration" and with custom analysis "collect-with-runsa"?
Thank you for your help
-- Bernard
- Mark as New
- Bookmark
- Subscribe
- Mute
- Subscribe to RSS Feed
- Permalink
- Report Inappropriate Content
>>Now the question is -- which "report" commands work with which analysis types? Do following reports: "hotspots, hw-events, top-down, summary, callstacks, gprof-cc" work with "uarch-exploration" and with custom analysis "collect-with-runsa"?
I suppose that depends on collected data. Summary and hotspots should be applicable for the most collection. hw-events could be reported for hardware collection (hotspots, uarch-exploration) - you should have perf or tb7 or vtss data traces in result directory. Callstacks are for collection with stacks and so on.
- Mark as New
- Bookmark
- Subscribe
- Mute
- Subscribe to RSS Feed
- Permalink
- Report Inappropriate Content
This is what I wanted to know.
Anyway, the ".tb7" file or ".perf" file can be always used with the VTune GUI version for complete analysis.
Best regards,
--Bernard
- Mark as New
- Bookmark
- Subscribe
- Mute
- Subscribe to RSS Feed
- Permalink
- Report Inappropriate Content
Hi Kirill,
I'm sending you a ".sc" file.
Thank you
Best regards,
--Bernard
- Mark as New
- Bookmark
- Subscribe
- Mute
- Subscribe to RSS Feed
- Permalink
- Report Inappropriate Content
I've used reports from you log
vtune.exe -r result -R summary
vtune.exe -r result -R hotspots
vtune.exe -r result -R -R summary -format=html
vtune.exe -r result -R hw-events -format=csv -csv-delimiter comma
- Mark as New
- Bookmark
- Subscribe
- Mute
- Subscribe to RSS Feed
- Permalink
- Report Inappropriate Content
Thank you
I will try those "report" commands out.
--Bernard
- Mark as New
- Bookmark
- Subscribe
- Mute
- Subscribe to RSS Feed
- Permalink
- Report Inappropriate Content
re-check import and reports with ".sc" file.
All repors were generated without any problems
- Mark as New
- Bookmark
- Subscribe
- Mute
- Subscribe to RSS Feed
- Permalink
- Report Inappropriate Content
Hi Bernard,
Has the solution provided by Kirill worked for you ? Please let us know if the issue still persists.
Regards,
Raeesa
- Mark as New
- Bookmark
- Subscribe
- Mute
- Subscribe to RSS Feed
- Permalink
- Report Inappropriate Content
Hi Raeesa,
Yes this problem was solved.
I do not want to create a new thread, hence I'm asking this question here.
Does VTune CLI have an option of parametrization of -knob event-config
For example I would like to lower the period, change the umask and require the higher skid reduction by using a "ppp" option.
The perf command below illustrates what I would like to set from the VTune CLI.
Is this possible?
cpu/period=0x186a3,event=0xe6,umask=0x1,name=\'BACLEARS.ANY\'/u
- Mark as New
- Bookmark
- Subscribe
- Mute
- Subscribe to RSS Feed
- Permalink
- Report Inappropriate Content
Yes you can use events modifiers which can be specified together with event delimited by colon. For example, this string:
MEM_INST_RETIRED.ALL_LOADS:sa=100000:os=no
will set period to 100000 and disable counting on 0 privilege level for the MEM_INST_RETIRED.ALL_LOADS event.
You can find the list of all supported modifiers and their descriptions in the SEP user guide here: https://software.intel.com/content/www/us/en/develop/download/sep-user-guide.html
Look for 'Event Modifiers' section.
- Mark as New
- Bookmark
- Subscribe
- Mute
- Subscribe to RSS Feed
- Permalink
- Report Inappropriate Content
Hi Dmitry,
Yes you can use events modifiers which can be specified together with event delimited by colon
This is the information I was looking for.
Thank you for quick response.
--Bernard
- Mark as New
- Bookmark
- Subscribe
- Mute
- Subscribe to RSS Feed
- Permalink
- Report Inappropriate Content
Hi Bernard,
Glad to know that the explanation provided by Kirill and Dmitry helped you. This thread will be no longer supported by Intel. Please raise a new thread if you have any further queries.We would be happy to help you out.
Thanks and Regards,
Raeesa
- Mark as New
- Bookmark
- Subscribe
- Mute
- Subscribe to RSS Feed
- Permalink
- Report Inappropriate Content
One remark that I forgot to mention.
if you import results (vtune -import result), vtune creates new directory (something like r@@@ and so on)
Reports should be generated for new r@@@ directory.
- Mark as New
- Bookmark
- Subscribe
- Mute
- Subscribe to RSS Feed
- Permalink
- Report Inappropriate Content
Hi Kirill,
I figured that out.
I have a question in regards to Dmitry answer.
The case of performance events modifiers -- I forgot to mention, that I'm using perf driverless collection mode.
Does driver-less mode support "SEP" type modifiers syntax?
Thank you
--Bernard
- Mark as New
- Bookmark
- Subscribe
- Mute
- Subscribe to RSS Feed
- Permalink
- Report Inappropriate Content
It must.
VTune converts sep events string to perf cmd and ll modifiers are applicable for perf
If you open driverless result you could find 3 files: sep.events, map.events, perfcmd
sep.events - sep configuration
map.events - mapping sep events to perf events
perfcmd - perf commandline that VTune will use
- Mark as New
- Bookmark
- Subscribe
- Mute
- Subscribe to RSS Feed
- Permalink
- Report Inappropriate Content
I know those .events files and especially the perfcmd file it was very helpful to learn those arcane modifiers settings to run perf record and perf stat commands.
Thanks for explanation, now everything is clear.
--Bernard
- Subscribe to RSS Feed
- Mark Topic as New
- Mark Topic as Read
- Float this Topic for Current User
- Bookmark
- Subscribe
- Printer Friendly Page