Hi,
Currently, I'm running analysis on the executable file generated from the compilation of C source code.
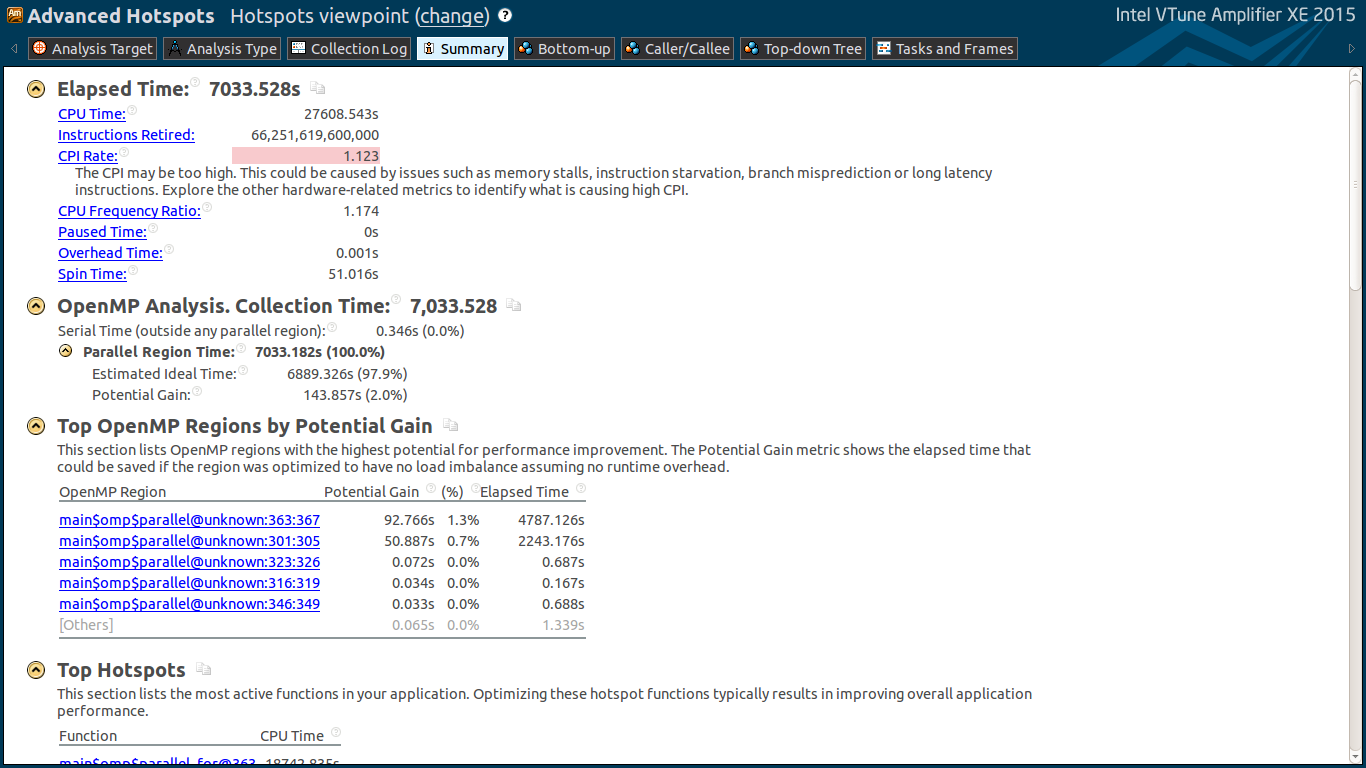
However, at the Summary window, certain OpenMP regions' CPU Usage Histograms are not displayed at the GUI, and some of them do.
Attached is the screenshot of Summary window. Hope it'll help to clarify my statement above.
Is there any solution to this problem?
Thank you.
.png)
.png)
链接已复制
Basically, I don't see 220-227 in the top five loops on the Summary and, except for the first two, the rest have insignificant time. Also, looks like you are pretty max'd out. Total potential gain is 2%! You're done! ;)
Also, notice, that the histogram shows you have exactly one instance of the loop at 220 and its duration is 0.0141789. I think there just isn't enough time to sample how many threads were active. If you used Advanced Hotspots, you can try reducing the sampling interval to 0.1 ms. But, seriously, why?!