- Mark as New
- Bookmark
- Subscribe
- Mute
- Subscribe to RSS Feed
- Permalink
- Report Inappropriate Content
hi,
Currently,I want profiling openmp* in my programs,so i write a test program,then compile it with icpc.run .but ,unfortunate VTune do not collect any openmp informations.
follow is my steps:
1、edit a sample test code,
2、edit makefile,
ADD_DEFINITIONS(-g -O2 -openmp),
SET(CMAKE_C_COMPILER icc)SET(CMAKE_CXX_COMPILER icpc)
TARGET_LINK_LIBRARIES(OMPMKL libiomp5.so mkl_rt)
3、make
4、run on debian 6(elapsed time : about 20s.),use command line :
amplxe-cl -collect advanced-hotspots -k collection-detail=stack-sampling -data-limit=0 --target-pid=20540.and the console print:
amplxe-cl -collect advanced-hotspots -k collection-detail=stack-sampling -data-limit=0 --target-pid=20540
amplxe: Collection started. To stop the collection, either press CTRL-C or enter from another console window: amplxe-cl -r /UIH/bin/r028ah -command stop.
amplxe: Collection detached.
amplxe: Collection stopped.
amplxe: Using result path `/UIH/bin/r028ah'
amplxe: Executing actions 16 % Resolving module symbols
amplxe: Warning: Cannot locate file `[vsyscall]'.
amplxe: Executing actions 16 % Resolving information for `libiomp5.so'
amplxe: Warning: Cannot locate debugging symbols for file `/usr/lib/libstdc++.so.6.0.13'.
amplxe: Executing actions 17 % Resolving information for `libdl-2.11.3.so'
amplxe: Warning: Cannot locate debugging symbols for file `/lib/libdl-2.11.3.so'.
amplxe: Executing actions 17 % Resolving information for `libpthread-2.11.3.so'
amplxe: Warning: Cannot locate file `vtsspp.ko'.
amplxe: Executing actions 17 % Resolving information for `vtsspp'
amplxe: Warning: Cannot locate debugging symbols for file `/lib/libpthread-2.11.3.so'.
amplxe: Executing actions 17 % Resolving information for `libmkl_intel_thread.s
amplxe: Warning: Cannot locate debugging symbols for file `/lib/libc-2.11.3.so'.
amplxe: Executing actions 18 % Resolving information for `ld-2.11.3.so'
amplxe: Warning: Cannot locate debugging symbols for file `/lib/ld-2.11.3.so'.
amplxe: Executing actions 50 % Generating a report
Collection and Platform Info
----------------------------
Parameter r028ah
------------------------ -----------------------
Application Command Line
Operating System 2.6.32-5-amd64 6.0.10
Computer Name debian-irip-test1
Result Size 68809086
Collection start time 02:02:34 16/12/2015 UTC
Collection stop time 02:02:58 16/12/2015 UTC
CPU
---
Parameter r028ah
----------------- -----------------------------------
Name Intel(R) Xeon(R) E5/E7 v2 processor
Frequency 2793150674
Logical CPU Count 20
Summary
-------
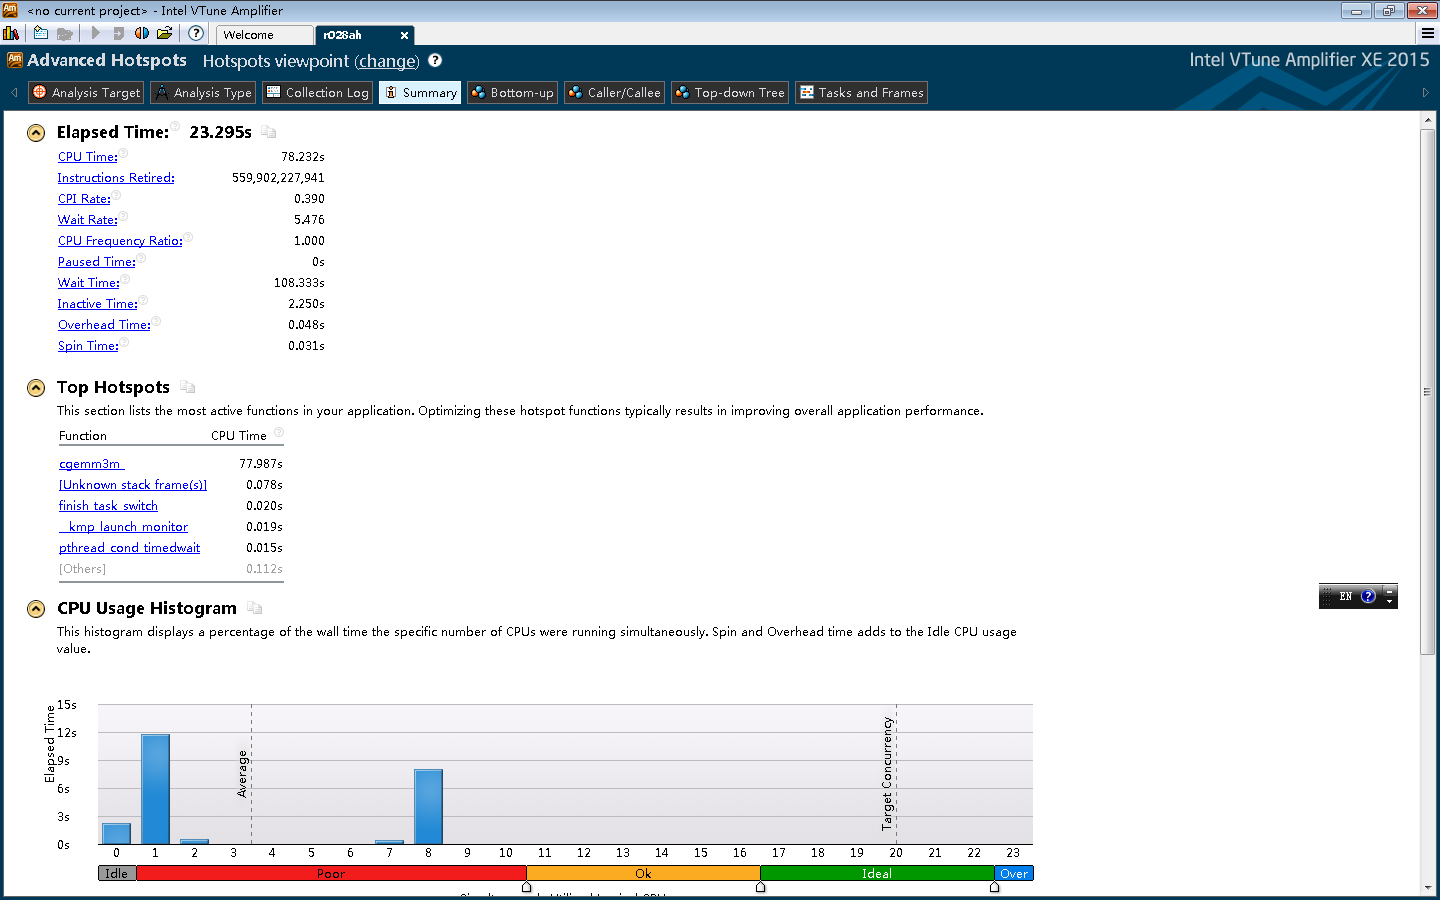
Elapsed Time: 23.295
CPU Time: 78.232
Average CPU Usage: 3.466
CPI Rate: 0.390
Event summary
-------------
Hardware Event Type Hardware Event Count:Self Hardware Event Sample Count:Self Events Per Sample
------------------------ ------------------------- -------------------------------- -----------------
INST_RETIRED.ANY 559902227941 109204 2800000
CPU_CLK_UNHALTED.THREAD 218545613987 109312 2800000
CPU_CLK_UNHALTED.REF_TSC 218514693572 109085 2000003
amplxe: Executing actions 100 % done
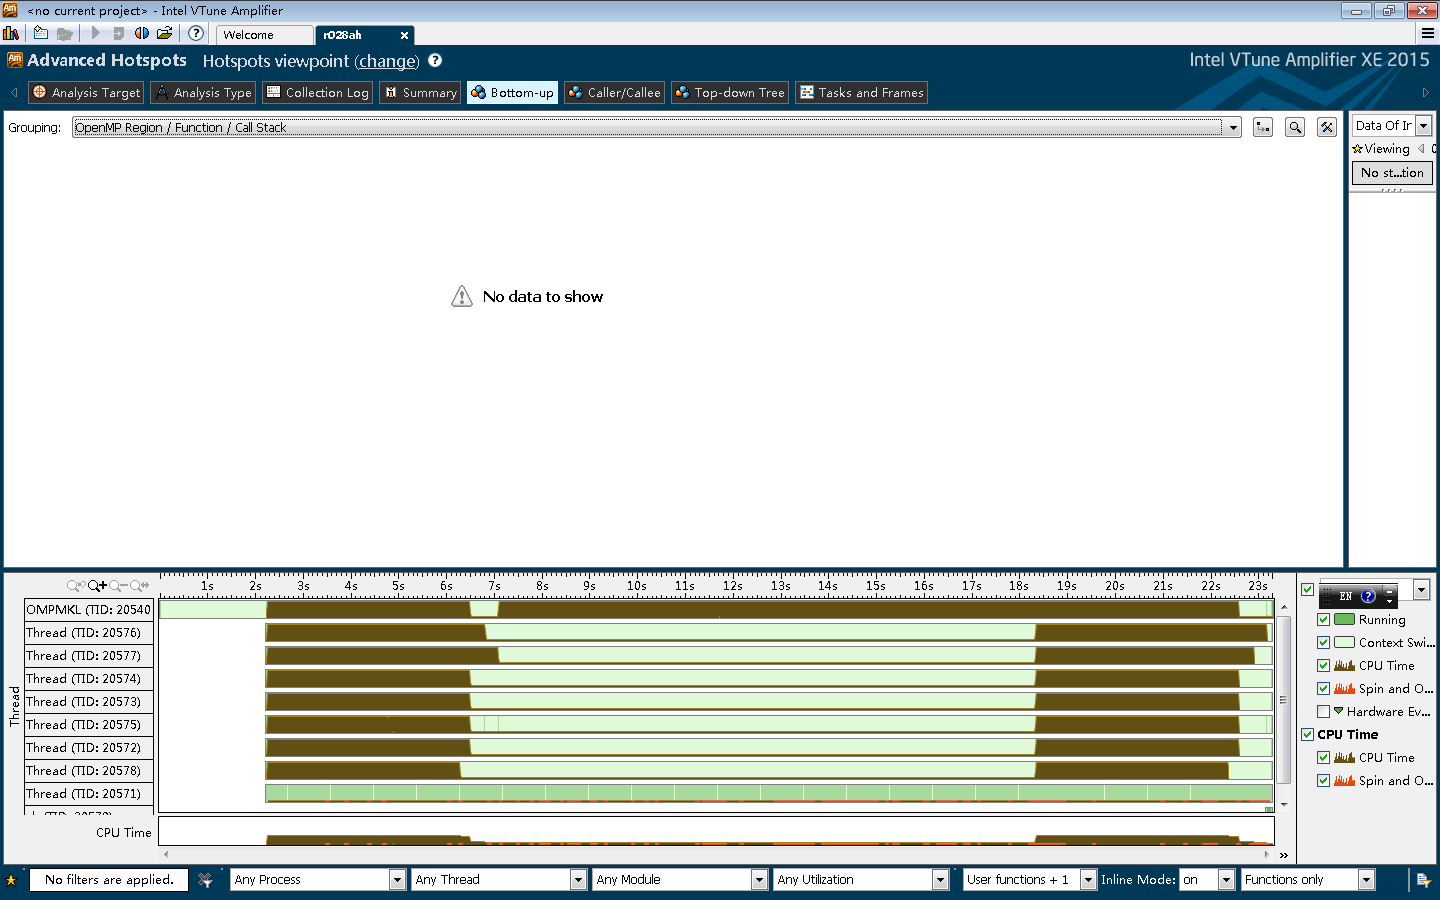
5、because i don't have linux gui,so copy the result to a windows7,and open result by VTune(windows version).
I did not find any openmp informations.
versions: icpc version 15.0.0 (gcc version 4.4.5 compatibility);VTune Amplifier XE 2015;
Intel(R) OMP Copyright (C) 1997-2014, Intel Corporation. All Rights Reserved.
Intel(R) OMP version: 5.0.20140611
Intel(R) OMP library type: performance
Intel(R) OMP link type: dynamic
Intel(R) OMP build time: 2014-06-13 19:14:45 UTC
Intel(R) OMP build compiler: Intel C++ Compiler 14.0
Intel(R) OMP alternative compiler support: yes
Intel(R) OMP API version: 4.0 (201307)
Intel(R) OMP dynamic error checking: no
Intel(R) OMP thread affinity support: not used
Intel(R) OMP debugger support version: 1.1
i can't understand what's wrong with me,somebody help me!
thank you very much.
Link Copied
- Mark as New
- Bookmark
- Subscribe
- Mute
- Subscribe to RSS Feed
- Permalink
- Report Inappropriate Content
- Mark as New
- Bookmark
- Subscribe
- Mute
- Subscribe to RSS Feed
- Permalink
- Report Inappropriate Content
Hello Yang,
Could you please upgrade VTune to 2016 U1 version? It might be the case that 2015 VTune that you use does not support attach mode for UserAPI that OpenMP runtime uses for VTune analysis.
Or try launch mode if you cannot upgrade.
Thanks & Regards, Dmitry
- Subscribe to RSS Feed
- Mark Topic as New
- Mark Topic as Read
- Float this Topic for Current User
- Bookmark
- Subscribe
- Printer Friendly Page