- Mark as New
- Bookmark
- Subscribe
- Mute
- Subscribe to RSS Feed
- Permalink
- Report Inappropriate Content
Hello.
I run SPECCPU2006 for both INT and FP programs with the following command:
runspec --config=mytest.cfg int -I
Now I want to use vtuneee for analyze each executable.
But when I select an executable and run the option "General exploration", keep running the analysis for more than 3 hours.
Would I need to select any input parameter when I analyze my executable?
And where would place the default input parameters I use SPEC?
Thank you so much.
Link Copied
- Mark as New
- Bookmark
- Subscribe
- Mute
- Subscribe to RSS Feed
- Permalink
- Report Inappropriate Content
Hi Danny:
Can you clarify a couple of things?
"elect an executable and run the option General exploration" - are you specifying a "target type" of "Launch Application" in GUI or are you specifying it on the command line after "--"? Can you show us how you are configuring it?
"keep running the analysis for more than 3 hours" - are you saying the application, "runspec" continues to run or does it complete and VTune Amplifier goes into the "finalization" stage and continues running for 3 hours?
Also, what OS are you on and what processor?
- Mark as New
- Bookmark
- Subscribe
- Mute
- Subscribe to RSS Feed
- Permalink
- Report Inappropriate Content
Hi.
Sorry for my english. I speak spanish and my english is basic.
I try again explain you again and in more detail what I try to do.
1) I run SPEC CPU2006, I used commands:
runspec --config=mytest.cfg int -I
runspec --config=mytest.cfg fp -I
2) Now I want to use Vtune for analyze the results how:
- CPU2006 Instruction profile (load, store, branch, other)
- Static code size
- Runtime
- L1 D cache miss
- L2 cache miss
- Branch miss
I do something similar to this paper from page 5 (http://www.ece.lsu.edu/lpeng/papers/isast08.pdf)
3) I already have the executables generated by SPEC, but i dont know exactly like using VTune and get those results.
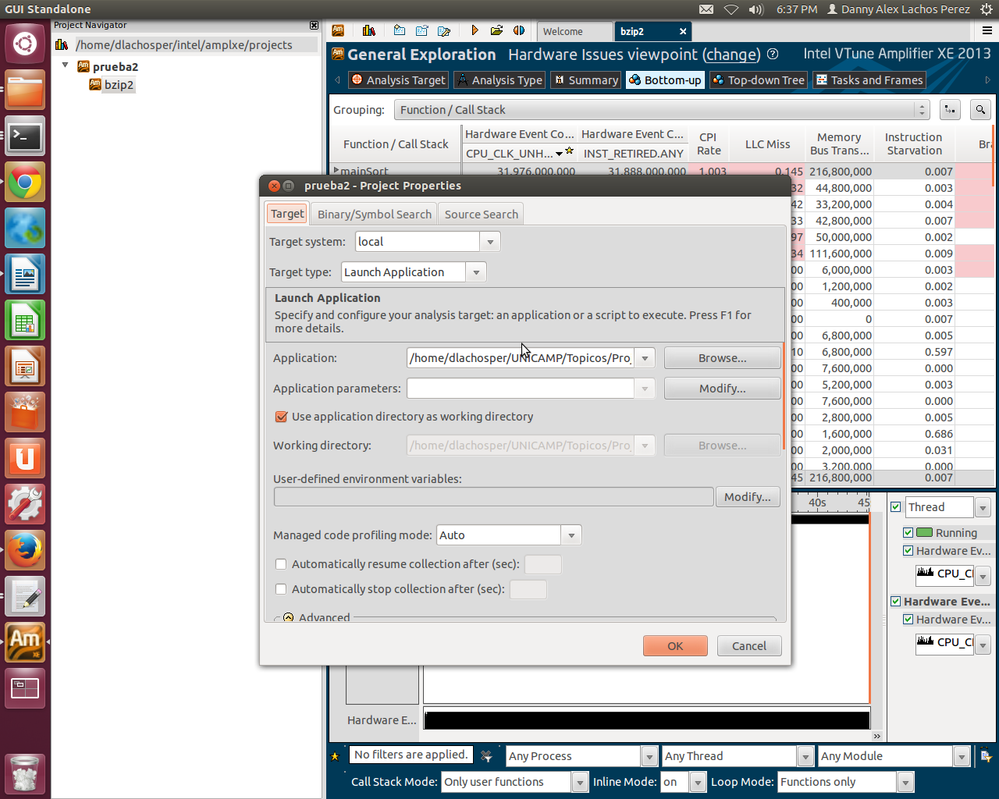
4) Here is a ScreenShot that vTune in my pc.
5) my pc has the following characteristics
root@dlachosper:~# cat /proc/cpuinfo
processor : 0
vendor_id : GenuineIntel
cpu family : 6
model : 15
model name : Intel(R) Core(TM)2 CPU 6400 @ 2.13GHz
stepping : 6
microcode : 0x44
cpu MHz : 1867.000
cache size : 2048 KB
physical id : 0
siblings : 2
core id : 0
cpu cores : 2
apicid : 0
initial apicid : 0
fpu : yes
fpu_exception : yes
cpuid level : 10
wp : yes
bogomips : 4255.77
clflush size : 64
cache_alignment : 64
address sizes : 36 bits physical, 48 bits virtual
power management:
Thank you
- Mark as New
- Bookmark
- Subscribe
- Mute
- Subscribe to RSS Feed
- Permalink
- Report Inappropriate Content
Yes, so you should specify "runspec" as the Application and "--config=mytest.cfg int -I " as the Application parameters.
Also, instead of General Exploration, on the Core(TM)2 processor you *can* create a custom analysis type and just collect the events of interest, e.g., L1D cache miss. See the help for "Custom Analysis - New Hardware Event-based Sampling Analysis" for details.
- Mark as New
- Bookmark
- Subscribe
- Mute
- Subscribe to RSS Feed
- Permalink
- Report Inappropriate Content
BTW, how long does the app usually run (outside of VTune Amplifier)? Make sure you set the "Duration time estimate" in the project properties appropriately.
- Mark as New
- Bookmark
- Subscribe
- Mute
- Subscribe to RSS Feed
- Permalink
- Report Inappropriate Content
Hi,
usually when I profile SPEC programs I do not create a project using the runspec program. Note that "runspec" is just an utility to help you start/stop benchmarks. Instead I create VTune projects referencing directly the benchmark executables.
Roughly speaking the steps are:
1) Build the benchmark using the runspec utility. runspect --action=built... bench1
2) Check the executable path and its input parameters listed at the end of the file bench1/run/run_.../speccmds.cmd
3) Create a VTune project using the infos obtained in step 2.
- Mark as New
- Bookmark
- Subscribe
- Mute
- Subscribe to RSS Feed
- Permalink
- Report Inappropriate Content
okay, but I don't see any "parameters" in the VTune Amplifier configuration dialog. Please tell me what you are entering for Application and Application parameters.
Also, as I said, please review the product documentation for information about configuring a Custom Analysis, or use General Exploration and then switch the Viewpoint to Hardware Event Counts to examine the individual events.
- Subscribe to RSS Feed
- Mark Topic as New
- Mark Topic as Read
- Float this Topic for Current User
- Bookmark
- Subscribe
- Printer Friendly Page
