- Mark as New
- Bookmark
- Subscribe
- Mute
- Subscribe to RSS Feed
- Permalink
- Report Inappropriate Content
I'm working on an OpenCL kernel targeting a Cyclone V SoC that should process a continuous real-time sample stream at a sample rate of 16 MHz, which requires a certain kernel clock frequency so that the kernel can keep up with the data stream. Coming from traditional VHDL design flows, I'm quite certain that a clock frequency of approx. 40 MHz should not be an issue for the Cyclone V.
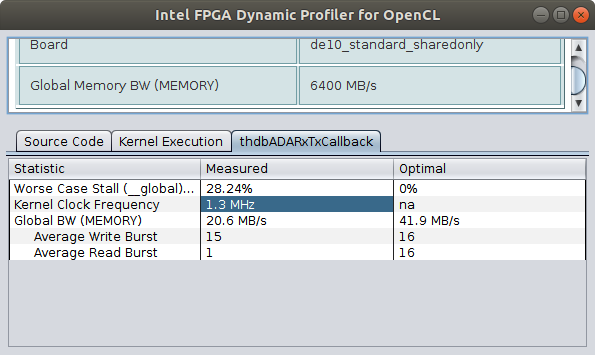
However, the kernel is extremely slow. The Dynamic Profiler shows that the kernel clock runs at 1.3MHz. How can I investigate what slows down the Kernel clock to such a low frequency, what are best practices to increase the kernel clock frequency?
See the attached screenshot for details
Profiling Results:
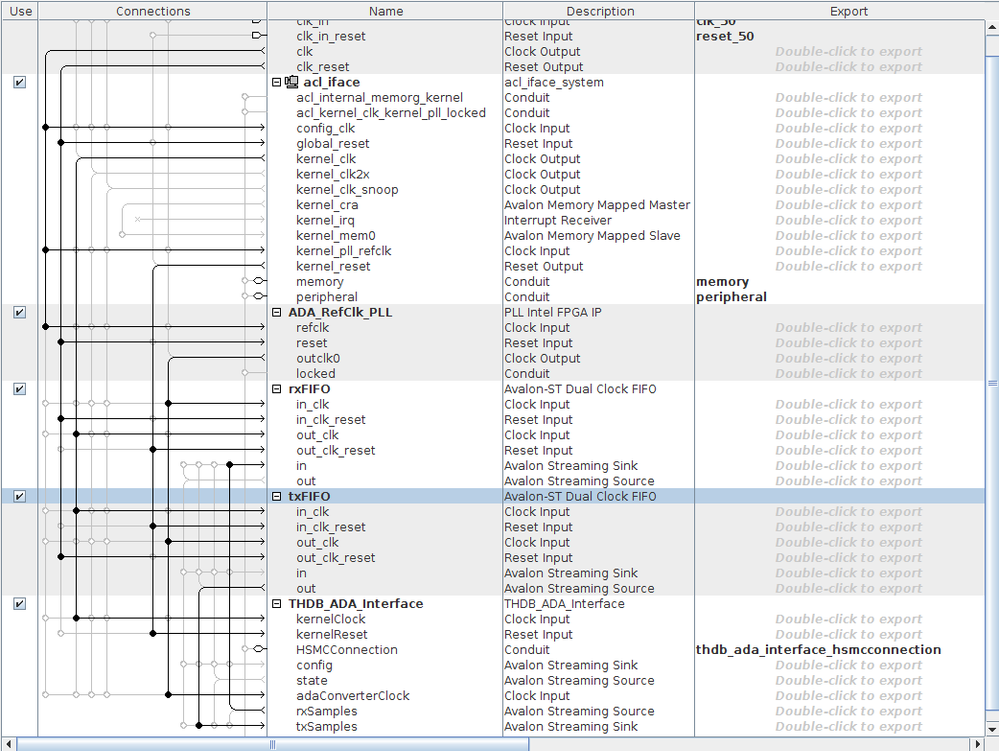
The Qsys System:
The kernel code:
#pragma OPENCL EXTENSION cl_intel_channels: enable

struct TwoChannelSample
{
    short2 chanA;
    short2 chanB;
};

#define FIFO_DEPTH 32768

channel struct TwoChannelSample rxSamps __attribute__((depth(0))) __attribute__((io("THDB_ADA_rxSamples")));
channel struct TwoChannelSample txSamps __attribute__((depth(0))) __attribute__((io("THDB_ADA_txSamples")));
channel ushort                  stateChan    __attribute__((depth(0))) __attribute__((io("THDB_ADA_state")));

kernel void thdbADARxTxCallback (global const       float2* restrict txSamples,
                                 global             float2* restrict rxSamples,
                                 global             ushort* restrict interfaceState)
{
    // get state from interface
    *interfaceState = read_channel_intel (stateChan);

    // Process sample-wise
    for (int i = 0; i < FIFO_DEPTH; ++i)
    {
        struct TwoChannelSample rxSample = read_channel_intel (rxSamps);

        rxSamples[i].x = (float)rxSample.chanA.x;
        rxSamples[i].y = (float)rxSample.chanA.y;
        rxSamples[i + FIFO_DEPTH].x = (float)rxSample.chanB.x;
        rxSamples[i + FIFO_DEPTH].y = (float)rxSample.chanB.y;
    }
}
- Mark as New
- Bookmark
- Subscribe
- Mute
- Subscribe to RSS Feed
- Permalink
- Report Inappropriate Content
You seem to be using a custom-made BSP with multiple custom I/O channels; your critical path very likely lies in your BSP. You can try compiling an empty OpenCL kernel to see what operating frequency you will get. If what you get is still in the same range, then your critical path is in the BSP and you should optimize your BSP.
Link Copied
- Mark as New
- Bookmark
- Subscribe
- Mute
- Subscribe to RSS Feed
- Permalink
- Report Inappropriate Content
Hi,
You can review Fmax information as in chapter 2.3.2 as link below:
The Fmax II report provides key performance metrics on all blocks including scheduled
fmax, sustainable II, block latency, and maximum interleaving iterations.
You can go though the best practice document as the link mentioned above and usually loop or memory usage having more impact on Fmax.
Thanks.
- Mark as New
- Bookmark
- Subscribe
- Mute
- Subscribe to RSS Feed
- Permalink
- Report Inappropriate Content
You seem to be using a custom-made BSP with multiple custom I/O channels; your critical path very likely lies in your BSP. You can try compiling an empty OpenCL kernel to see what operating frequency you will get. If what you get is still in the same range, then your critical path is in the BSP and you should optimize your BSP.
- Mark as New
- Bookmark
- Subscribe
- Mute
- Subscribe to RSS Feed
- Permalink
- Report Inappropriate Content
@HRZ was right, the problem was into my BSP. Running the Quartus Timing Analysis for my BSP revealed that an unconstrained path that intentionally crossed clock domains lead to bad results, adjusting the sdc file for the project fixed this and brought the clock back up to 150 MHz again which is absolutely fine for my use case.
Seems like the aocl compiler tool runs the same timing analysis as quartus does and adjusts the Kernel clock based on those results, is that right, @MeiYanL_Intel? I did not find any information on that in the CL SDK documentation, nor did I find the results of the timing analysis that's obviously running in the background in the compiler report. Did I overlook something here? Last but not least, I also did not find the report you mentioned, as I'm on a Cyclone V, I use the latest version of the Standard SDK which is 18.1, however you linked me to the 19.x Pro version docs. Is it possible that these reports were added with the 19.x releases and are not contained in the 18.x releases of the SDK?
- Mark as New
- Bookmark
- Subscribe
- Mute
- Subscribe to RSS Feed
- Permalink
- Report Inappropriate Content
This is not documented anywhere but apparently, the OpenCL compiler first uses a very high frequency to place and route the design and then, based on the timing report, adjusts the kernel PLL and re-routes the design with the maximum-achievable value determined by the timing report. If the re-route fails timing, then the compiler will incrementally reduce the frequency and redo the routing until timing is met or maximum number of retrials has been reached.
If you look in the folder that is created by the OpenCL compiler when compiling a kernel, you will find a set of *.rpt files which are the text reports for synthesis, fitting, routing, etc. The timing report is in *.sta.rpt. In the same folder, there is another folder called "report" in which you can find the pre-synthesis HTML report generated by the OpenCL compiler which includes the information @MeiYanL_Intel mentioned above; however, the report tends to change quite a bit with every new version of the compiler.
- Mark as New
- Bookmark
- Subscribe
- Mute
- Subscribe to RSS Feed
- Permalink
- Report Inappropriate Content
Hi,
Thanks @Hamid Reza Zohouri.
After I compare both edition in Quartus, I found that the fmax report can be view directly in 19.x GUI while you still can view fmax in the loop analysis report as in figure 53 in document as link: https://www.intel.com/content/dam/www/programmable/us/en/pdfs/literature/hb/opencl-sdk/ug-aoclstd-best-practices-guide.pdf
Thanks
- Subscribe to RSS Feed
- Mark Topic as New
- Mark Topic as Read
- Float this Topic for Current User
- Bookmark
- Subscribe
- Printer Friendly Page

