- Mark as New
- Bookmark
- Subscribe
- Mute
- Subscribe to RSS Feed
- Permalink
- Report Inappropriate Content
Hi,
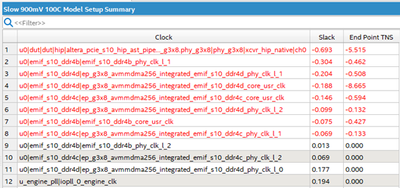
Sometimes I found that timing reports in Timing Analyzer differs from timing Summary in Compilation Report.
For example, the Setup Summary at 900mV 100C corner is following figure.
The first one is PCIe clock, and slack is -0.693ns.
But, when I open Timing Analyzer and report timing of this clock,
it shows no timing violation.
The worst path is 0.048ns:
Does anyone know the reason?
Thanks.
Link Copied
- Mark as New
- Bookmark
- Subscribe
- Mute
- Subscribe to RSS Feed
- Permalink
- Report Inappropriate Content
That's certainly strange. Can you right-click the failing clock(s) in the compilation report and generate a timing report from there? Perhaps your report_timing command is not exactly matching up with what is shown as failing in the Compilation Report.
#iwork4intel
- Mark as New
- Bookmark
- Subscribe
- Mute
- Subscribe to RSS Feed
- Permalink
- Report Inappropriate Content
Hi @sstrell
You are right.
The command generated from compilation report is different from mine.
My report_timing command set both startpoints and endpoints.
Thanks.
- Mark as New
- Bookmark
- Subscribe
- Mute
- Subscribe to RSS Feed
- Permalink
- Report Inappropriate Content
Hi,
Since your question has been answered, I now transition this thread to community support. If you have a new question, feel free to open a new thread to get the support from Intel experts. Otherwise, the community users will continue to help you on this thread. Thank you.
Best regards,
KhaiY
- Subscribe to RSS Feed
- Mark Topic as New
- Mark Topic as Read
- Float this Topic for Current User
- Bookmark
- Subscribe
- Printer Friendly Page


